


The AAC Patent Portfolio offers a useful window into how a leading acoustic components manufacturer protects its engineering output. Across 10,872 total patent families, 40.7% remain active, a figure covering both granted and pending cases. Of these, 3,542 families have been granted and 885 are still pending examination, giving a grant rate of 32.6%. The remaining families, numbering 6,445 when lapsed, revoked and expired cases are combined, have fallen out of active protection. These are prosecution and maintenance metrics, and should not be read as a judgment on patent quality or enforceability.
Filing activity peaked in 2018, when AAC filed 1,938 patent families in a single year, a sharp jump from prior years. China stands out as the dominant jurisdiction, accounting for 85.1% of filings across 10 jurisdictions tracked in this portfolio. On the technology side, loudspeaker and audio related innovation under H04R Loudspeakers and Audio leads the portfolio with 4,387 families, consistent with AAC’s acoustic components heritage.
This report draws on filing, legal status and jurisdictional data to frame how AAC has built and maintained its patent position. Filing volume alone does not establish commercial success, product adoption or competitive superiority in any given market. Readers evaluating specific patent families for licensing, due diligence or competitive benchmarking should verify current legal status and claims directly before relying on them externally.
About AAC
Company Profile: AAC Technologies Holdings Inc., commonly known as AAC, is a Chinese technology manufacturer headquartered in Shenzhen, China. It is a civilian-run enterprise that engages in the design, development, manufacture and distribution of miniaturized components. AAC designs, develops and manufactures miniaturized components including speakers, receivers and microphones in the acoustic segment, producing these for mobile devices such as smartphones and tablets.
The company was founded in 1993. It has been listed on the Hong Kong Stock Exchange since 2005, manufacturing miniature loudspeakers, receivers and MEMS microphones for Apple and Samsung mobile devices. Its business extends beyond acoustics into precision mechanics, optics and electromagnetic drives, supporting the broader smart device supply chain. AAC trades under ticker 2018 on the Hong Kong Stock Exchange and is part of the Hang Seng Index. Koh Boon Hwee serves as chairman.
The company operates across global markets, serving major international electronics manufacturers as a key components supplier.
How Healthy is AAC Patent Portfolio?
Patent portfolio health depends heavily on legal status composition, and AAC’s numbers tell a layered story. Granted families make up 32.6% of the total, while 8.1% remain pending and still moving through examination. Lapsed cases dominate at 47.0%, with revoked and expired families adding 6.0% and 6.3% respectively. The composition chart in this section makes clear that lapsed status, typically tied to unpaid renewal fees rather than rejection, is the single largest category.
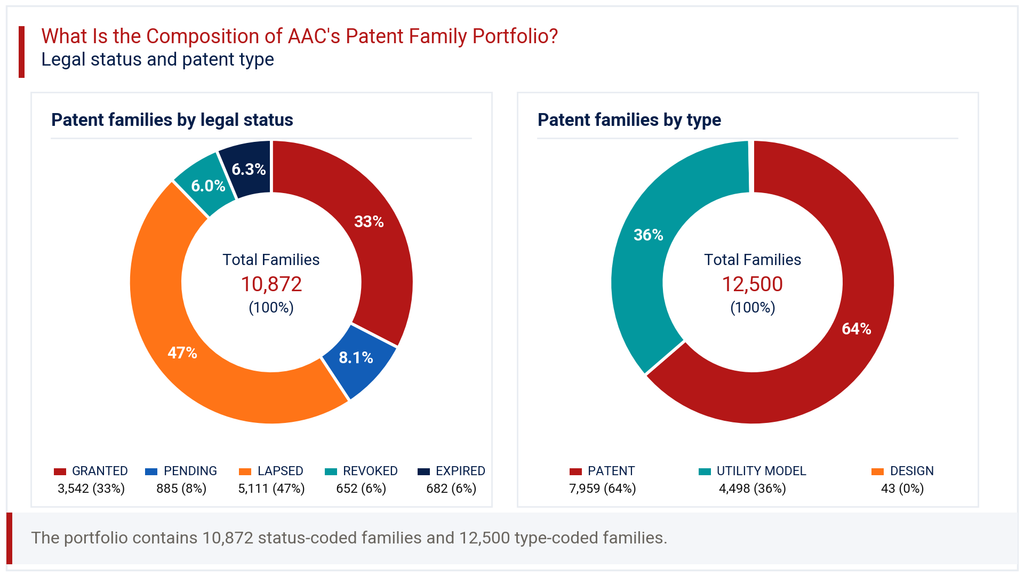
On patent type, traditional patents account for 63.7% of filings, utility models make up 36.0%, and design patents form a marginal 0.3%. This split reflects a dual filing strategy common among Chinese manufacturers, pairing full patent applications with faster, cheaper utility model protection. The heavy lapsed share suggests AAC lets a sizeable portion of older filings expire rather than maintaining broad coverage indefinitely. This is a normal pattern for high-volume filers managing renewal costs across thousands of families, not necessarily a sign of weak innovation output.
How Has the AAC Patent Portfolio Evolved Over Time?
Patent filing trends at AAC show a long buildup followed by a dramatic surge and a recent pullback. Annual filings stayed under 260 through most of the 2008 to 2014 period, then climbed steadily from 368 in 2015 to a peak of 1,938 in 2018. The filing-trend chart in this section shows 2019 and 2020 still running high at 1,728 and 1,412 respectively, before a steep drop to 341 in 2021.
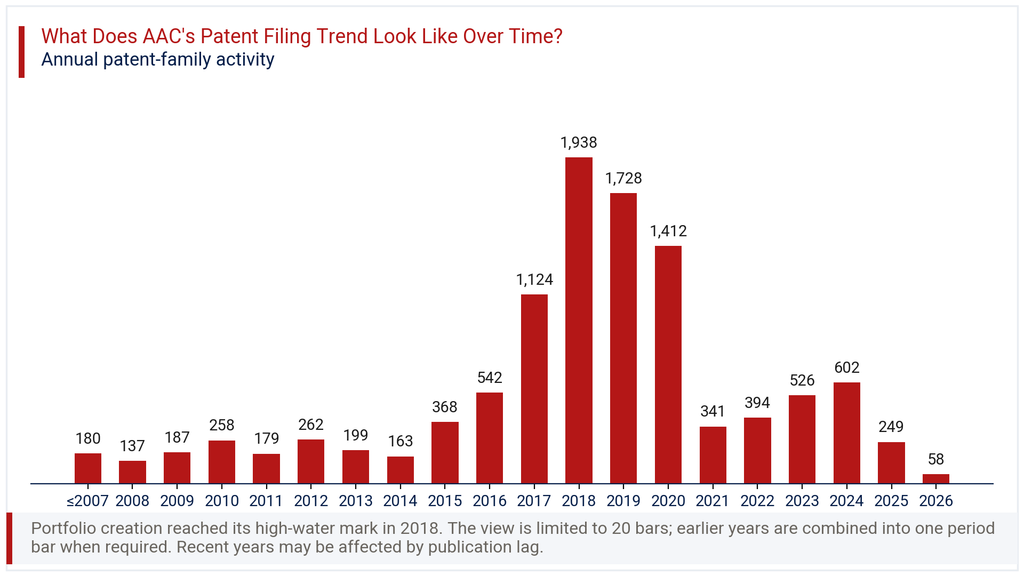
Filings recovered gradually afterward, reaching 602 in 2024. The 2025 and 2026 figures of 249 and 58 reflect publication lag rather than a genuine collapse in filing activity, since recently filed applications often take time to appear in public databases. The latest year change of -76.7% should be read with this lag in mind rather than as a literal measure of declining research output. The underlying pattern still points to a portfolio that scaled sharply around 2017 to 2020 before settling into a steadier filing rhythm.
Where Does the AAC Patent Portfolio Prioritize Patent Protection?
Patent geography within this portfolio is heavily concentrated in AAC’s home market. China accounts for 85.1% of all filings, a scale that dwarfs every other jurisdiction tracked. The United States follows at 32.5%, with WIPO PCT filings close behind at 30.0%, indicating meaningful use of international applications for later national entry.
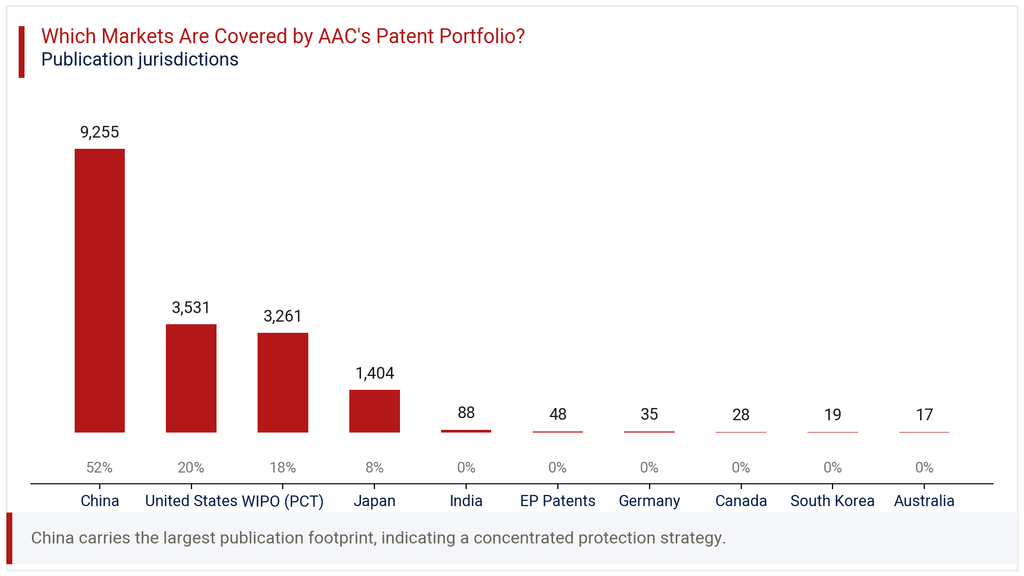
Japan holds 12.9% share, while India, EP Patents, Germany, Canada, South Korea and Australia each register below 1%. The geographic chart in this section highlights just how top-heavy this distribution is across the 10 jurisdictions covered. This pattern is typical of a China-based manufacturer protecting core manufacturing and design output domestically first, then extending selectively into the United States and via PCT routes where its customers, largely global smartphone brands, actually sell devices. The limited presence in Europe and other markets suggests AAC prioritizes cost-efficient, high-value jurisdictions over broad global filing.
Where is the AAC Patent Portfolio Building Protection Across Key Technologies?
IPC analysis of the AAC Patent Portfolio points squarely toward acoustics as the technological core. H04R Loudspeakers and Audio leads with 4,387 families, representing 39.5% of all classified filings. G02B Optical Elements, Systems and Instruments follows at 2,996 families and 27.0% share, reflecting AAC’s expansion into camera and optical components for smartphones.
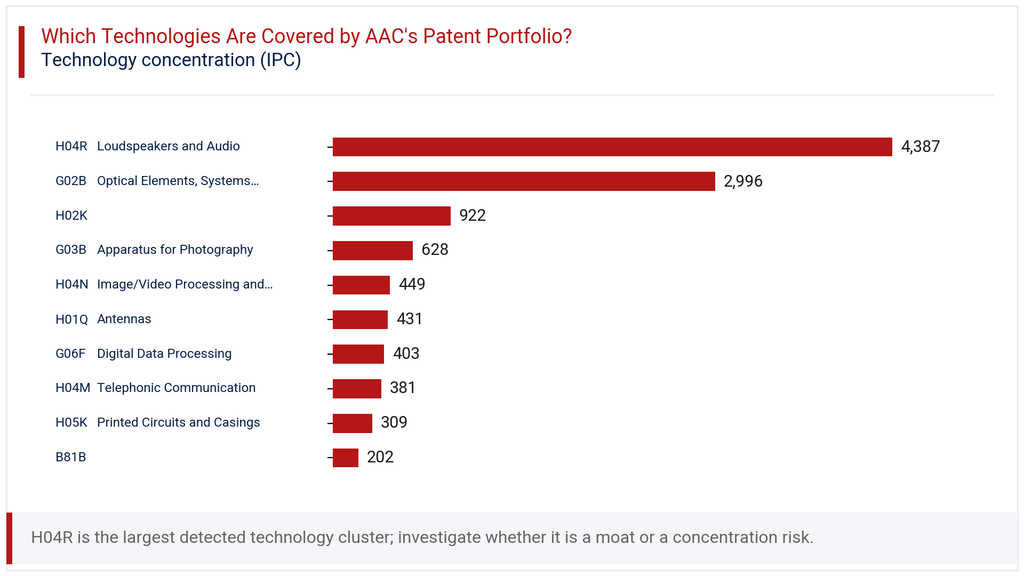
Further down, H02K electromagnetic machinery technology accounts for 8.3%, while G03B Apparatus for Photography holds 5.7%. The technology chart in this section also shows smaller but notable clusters in H04N Image/Video Processing and Display at 4.0% and H01Q Antennas at 3.9%. This spread confirms AAC’s evolution from a pure acoustics specialist into a broader smart device component supplier, with optics now a clear second pillar alongside sound. The technology mix supports the company’s public positioning across acoustics, optics and precision mechanics.
How Has the AAC Patent Portfolio Evolved Across Filing Geographies?
Viewing filings by year and jurisdiction together reveals how AAC’s geographic strategy shifted during its growth phase. China led every year from 2015 onward, rising from 362 filings to a peak of 1,723 in 2018. The heatmap in this section shows the United States climbing in step, reaching 657 filings that same year before settling into a steadier 300 range band later.
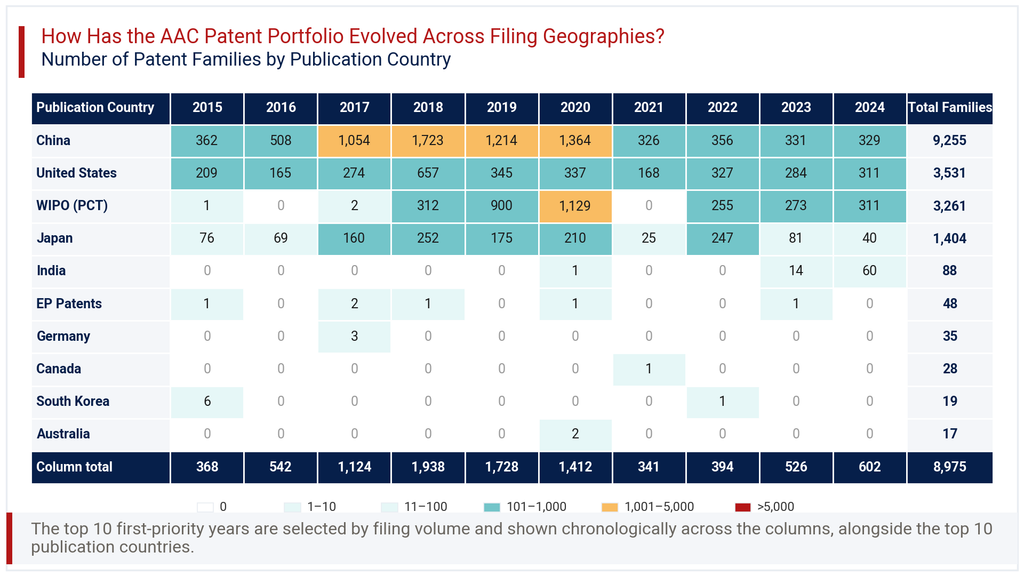
WIPO PCT filings tell a distinct story, jumping from near zero before 2018 to 312, then surging to 900 in 2019 and 1,129 in 2020. This timing suggests AAC adopted international PCT filing more aggressively just as its China filings began moderating. Japan stayed in the 150 to 250 range for most years but dropped sharply after 2021. India only entered the picture meaningfully in 2023 and 2024, suggesting a newer market priority still in its early stages.
Consultant’s Perspective on AAC Patent Portfolio
Taken as a whole, the AAC Patent Portfolio reflects a manufacturer whose intellectual property strategy closely tracks its product roadmap. The acoustics concentration under H04R is expected given AAC’s origins, but the 27.0% share in optics signals a real diversification bet, not a token filing exercise. The China-heavy jurisdiction mix, at 85.1%, is rational for a domestic manufacturer but leaves question marks over how well protected AAC’s innovations are in markets like Europe, Korea and Australia, where exposure remains under 1% each.
The 2017 to 2020 filing surge, followed by the sharp 2021 drop, likely reflects both a strategic filing push tied to new product categories and a subsequent normalization. Given the 47.0% lapsed share, AAC appears to prune older filings actively rather than hold dead weight, which is a sound capital allocation practice for a components supplier operating on thin margins. Going forward, stakeholders assessing this portfolio should track whether the 2023 and 2024 recovery in filings continues, and whether optical and electromagnetic drive technologies keep gaining share relative to core acoustics.
Explore Deeper Insights with Expertlancing Research
This overview only scratches the surface of what AAC’s patent filings reveal about its technology priorities and market strategy. Expertlancing Research helps clients go deeper, validating specific families, benchmarking against competitors and mapping white space for new filings. If you are assessing AAC for partnership, licensing, investment or competitive tracking purposes, our analysts can build a tailored brief around your specific question. Reach out to discuss how a focused patent intelligence engagement can support your next decision.