


The Xiamen Sanan Patent Portfolio covers 1083 patent families, giving a clear picture of how the company protects its semiconductor and LED technology. Of these families, 78.9% remain active, combining both granted and pending cases. The portfolio includes 767 granted patents and 88 pending applications, translating to a grant rate of 70.8%. A combined 228 families fall under lapsed, revoked, or expired status. These figures reflect prosecution and maintenance outcomes only, not a judgment on patent quality or enforceability.
Filing activity peaked in 2020, when the company filed 119 patent families, the highest count in its recorded history. China dominates the jurisdiction mix, accounting for 96.7% of filings, with the portfolio spread across 8 jurisdictions in total. On the technology side, H01L Semiconductor Devices leads by a wide margin, with 769 families, making it the clear technological core of Xiamen Sanan’s filing strategy.
This report draws on patent filing records to assess how Xiamen Sanan has built and maintained its intellectual property position over time. Filing volume alone does not confirm commercial success or a lasting competitive edge in the market. Readers evaluating specific patent families for licensing, litigation, or investment decisions should verify details directly with patent offices. The analysis that follows is meant to guide informed business judgment, not replace formal due diligence.
About Xiamen Sanan
Company Profile: Xiamen Sanan, officially Sanan Optoelectronics Co. Ltd., is a publicly listed Chinese company engaged in full-color high-brightness light-emitting diode wafer and chip manufacturing. The company was founded on 12 November 2000 by Lin Xiucheng. It is headquartered in Xiamen, Fujian, China, and listed on the Shanghai Stock Exchange. Leadership includes Lin Zhiqiang as Chairman and Lin Kechuang as CEO.
Through its subsidiary Sanan IC, the group expanded into compound semiconductors, serving microwave radio frequency, power electronics and optical device markets, with branches established in multiple countries including China, the United States, Japan, Germany, the United Kingdom, and Singapore. The company emphasizes self-developed chips, as it continues to develop and produce Chinese chips with independent intellectual property rights. Financially, Sanan reported revenue of CN¥14.05 billion in 2023, with net income of CN¥366.56 million and 15,439 employees that year.
How Healthy is Xiamen Sanan Patent Portfolio?
Patent portfolio health depends heavily on legal status distribution, and Xiamen Sanan shows a reasonably strong position here. Granted patents make up 70.8% of the total, while pending applications add another 8.1%. Together, these active cases bring the overall active rate to 78.9%, as shown in the composition chart. The remaining share splits across lapsed cases at 5.9%, revoked cases at 8.9%, and expired cases at 6.3%.
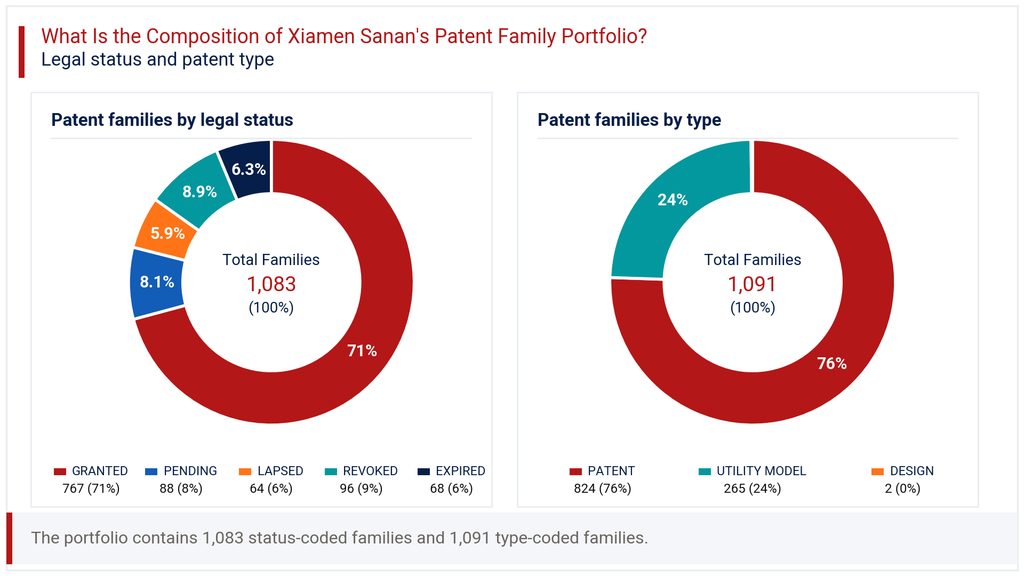
By patent type, traditional patents dominate at 75.5%, followed by utility models at 24.3%, with design filings forming a negligible 0.2%. This mix suggests Xiamen Sanan relies primarily on full patent protection rather than the faster but narrower utility model route common in China. The revoked share, close to 8.9%, deserves attention since it exceeds the pending rate. It may point to validity challenges or deliberate portfolio pruning in certain technology areas. Taken together, the legal status data signals a maturing, actively managed patent position, not one left to lapse passively over time.
How Has the Xiamen Sanan Patent Portfolio Evolved Over Time?
Patent filing trends for Xiamen Sanan show a steady climb from single digits before 2008 to a sustained high plateau between 2015 and 2021. Filings rose from just 14 families in the earliest recorded period to 86 in 2015, then 90 in 2016. The filing-trend chart shows this momentum carrying through 2019 at 83 families, before reaching a peak of 119 in 2020.
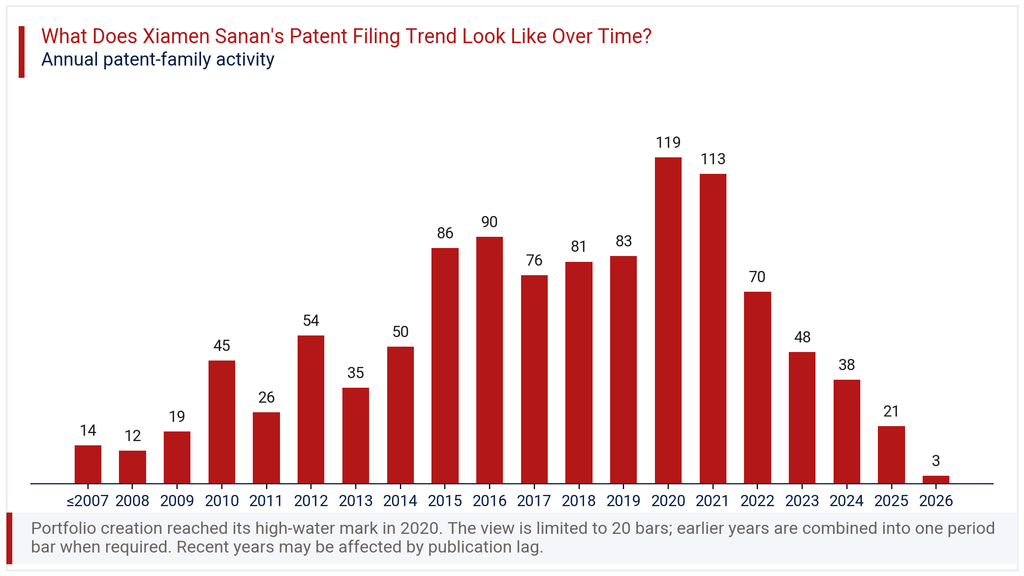
Volumes declined after that peak, falling to 113 in 2021, then 70 in 2022, and further to 48 in 2023. The most recent years, 2024 and 2025, show lower counts of 38 and 21 respectively, with a sharp latest_year_change_pct drop of -85.7%. This apparent fall largely reflects publication lag rather than an actual pullback in filing activity. Patent applications typically take 18 months or longer to appear in public databases. The true filing picture for 2024 and 2025 will likely look stronger once records catch up.
Where Does the Xiamen Sanan Patent Portfolio Prioritize Patent Protection?
Patent geography for Xiamen Sanan centers overwhelmingly on its home market. China accounts for 96.7% of all filings, as the geographic chart makes clear, reflecting 1047 families filed there. This concentration is typical for a Chinese manufacturer focused on serving a large domestic semiconductor and LED supply chain first.
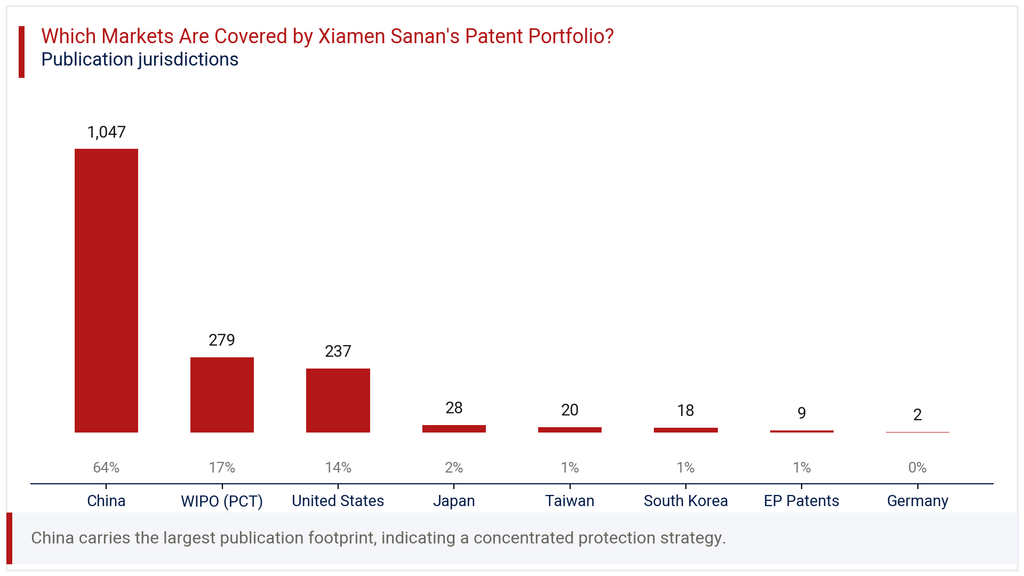
International protection follows a distinct secondary tier. WIPO PCT filings represent 25.8% of the portfolio, a route often used to preserve options before entering specific national markets. The United States holds 21.9% share with 237 families, marking it as the clear priority market outside China. Japan, Taiwan, and South Korea trail well behind, at 2.6%, 1.8%, and 1.7% respectively. Germany and the broader European Patent filings remain minimal, at 0.2% and 0.8%. This pattern suggests Xiamen Sanan treats the United States as its main export protection market, with Europe and other parts of Asia receiving comparatively limited patent investment.
Where is the Xiamen Sanan Patent Portfolio Building Protection Across Key Technologies?
IPC analysis of the Xiamen Sanan Patent Portfolio points to a heavy concentration in core semiconductor technology. The technology chart in this section shows H01L Semiconductor Devices leading decisively, with 769 families and a 67.0% share. No other category comes close to this scale, confirming semiconductor device structures as the company’s primary area of invention.
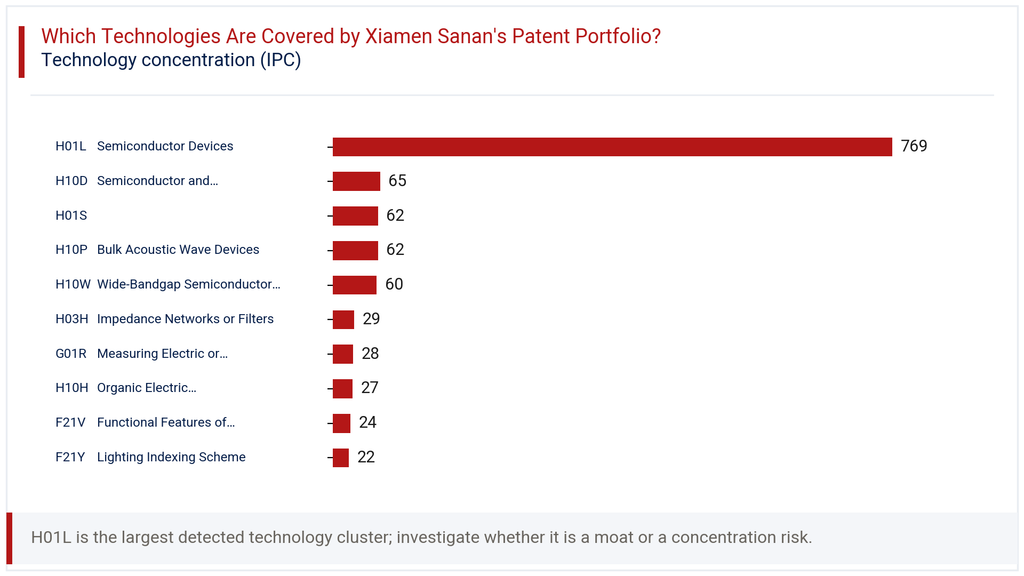
Several secondary clusters round out the portfolio. H10D Semiconductor and Solid-State Devices holds 65 families at 5.7%, closely followed by H01S with 62 families at 5.4%. Bulk acoustic wave devices under H10P also carry 62 families, matching 5.4% share, while wide-bandgap semiconductor devices under H10W account for 60 families at 5.2%. Smaller clusters include impedance networks, measuring instruments, organic solid-state devices, and lighting-related categories, each below 3% share. This spread indicates Xiamen Sanan’s innovation effort concentrates tightly around semiconductor fabrication, with lighting and measurement technologies playing a supporting role rather than a central one.
How Has the Xiamen Sanan Patent Portfolio Evolved Across Filing Geographies?
The heatmap of filings by year and jurisdiction reveals how China has consistently anchored Xiamen Sanan’s patent activity. Chinese filings rose from 52 in 2012 to a peak of 116 in 2020, mirroring the overall portfolio trend. This domestic surge aligns closely with the company’s broader expansion into compound semiconductors during this period.
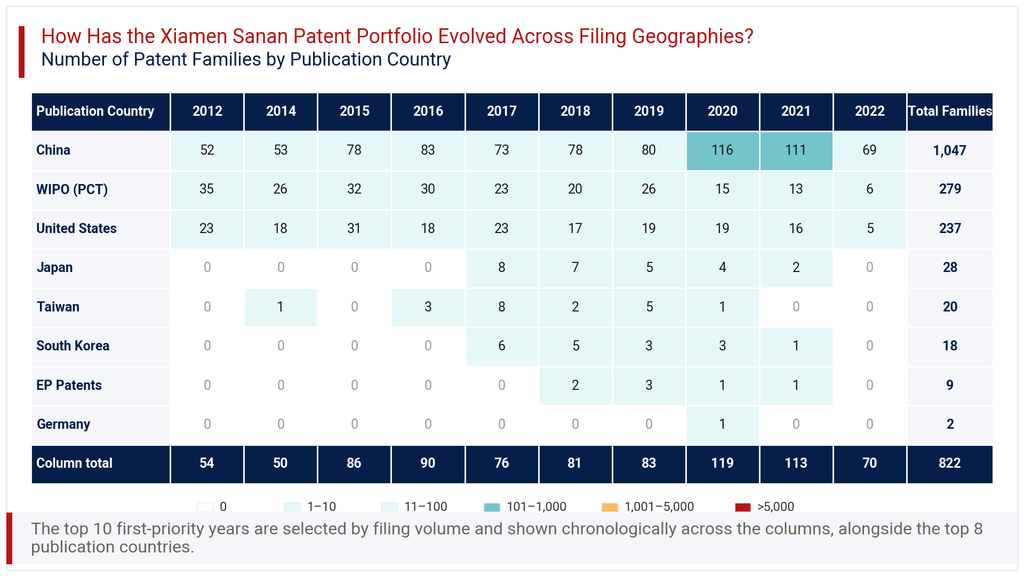
International filings tell a more cautious story. WIPO PCT filings peaked early, at 35 in 2012, then gradually declined to just 6 by 2022. United States filings held relatively steady through the decade, ranging between 16 and 31 families annually, before dropping to 5 in 2022. Japan, Taiwan, and South Korea show short bursts of activity concentrated around 2017 to 2019, then taper off sharply. Germany appears only once, with a single filing in 2020. This pattern suggests international filing decisions followed specific product launches or market entry windows, rather than a continuous global filing programme.
Consultant’s Perspective on Xiamen Sanan Patent Portfolio
The Xiamen Sanan Patent Portfolio reflects a company firmly rooted in domestic manufacturing strength, with selective international reach. A 70.8% grant rate and 78.9% active rate indicate a well-managed filing process rather than opportunistic over-filing. The heavy tilt toward H01L Semiconductor Devices, at 67.0% of all families, confirms a focused technical identity around core semiconductor fabrication.
What stands out is the gap between domestic and international filing intensity. China alone holds 96.7% share, while the United States, the next largest market, sits at just 21.9%. For a company with manufacturing operations and branches across several countries, this gap is worth monitoring closely. It may reflect a deliberate choice to protect manufacturing know-how primarily at home while licensing or exporting products under other arrangements.
Looking forward, the apparent filing decline in 2023 through 2025 should not be read as reduced innovation activity. Publication lag almost certainly understates the true recent filing volume. Stakeholders assessing Xiamen Sanan for partnership, supply chain, or competitive benchmarking purposes should track filing updates over the next 12 to 18 months. The revoked case share, at 8.9%, also merits periodic review as those proceedings resolve.
Explore Deeper Insights with Expertlancing Research
This overview offers a starting point for understanding Xiamen Sanan’s patent position, but real business decisions need deeper validation. Expertlancing Research helps clients go beyond headline figures, examining specific patent families, claim scope, and competitive overlaps relevant to their business questions. Whether the need is licensing due diligence, freedom-to-operate analysis, or competitive benchmarking, our team structures the research around the decision at hand. Reach out to Expertlancing Research to commission a tailored patent intelligence study built for your specific requirements.