


The ALIBABA Patent Portfolio spans 32,474 patent families, offering a window into how one of China’s largest technology groups protects its innovation output. Of this total, 71.9% remains active, a figure covering both granted and pending families. Granted families stand at 17,807, while 5,546 remain pending before patent offices worldwide. The grant rate across the portfolio sits at 54.8%, and a combined 9,121 families fall into lapsed, expired, or revoked status. These figures reflect prosecution and maintenance outcomes only, not a judgment on patent quality or enforceability.
Filing activity peaked in 2022, when the company filed 4,185 families, the highest single-year count in the dataset. China dominates as the top jurisdiction, accounting for 84.6% of filings, and the portfolio spans 10 jurisdictions in total. On the technology side, G06F Digital Data Processing leads as the top cluster, with 18,262 families, far ahead of any other classification.
This report draws on structured patent filing records to map where ALIBABA concentrates its research investment and legal protection efforts. Filing volume alone does not establish commercial success, product adoption, or competitive superiority in any given market. Readers should treat the patterns here as directional evidence, and validate any individual family of interest before using it for external or investment decisions.
About ALIBABA
Company Profile: Alibaba Group Holding Limited is a Chinese multinational technology company. It specializes in e-commerce, retail, Internet, and technology. Founded on 28 June 1999 in Hangzhou, Zhejiang, the company provides consumer-to-consumer, business-to-consumer, and business-to-business sales services via Chinese and global marketplaces. It also runs local consumer, digital media, logistics and cloud computing businesses.
Its services include Alibaba.com, Alibaba Cloud, AliExpress, AliOS, Taobao, Tmall, Lazada, 1688.com, and Daraz. Products include AliOS, AliGenie, DingTalk, and Tongyi Qianwen, its Qwen AI model family. Alibaba is headquartered in Hangzhou and George Town, Cayman Islands, and serves customers worldwide. For fiscal year 2026, revenue reached US$148.40 billion, with operating income of US$7.27 billion. Net income stood at US$15.01 billion, with total assets of US$276.83 billion. The company employed 124,320 people in FY2025. Joseph Tsai serves as chairman and Eddie Wu as CEO.
How Healthy is ALIBABA Patent Portfolio?
Patent portfolio health depends heavily on legal status composition, and the ALIBABA numbers tell a layered story. Granted families make up 54.8% of the total, giving the company a solid base of enforceable rights. Pending applications account for 17.1%, representing a meaningful pipeline still under examination. Together, these active categories support the 71.9% active rate cited earlier. The composition chart in this section shows this split clearly against the inactive categories.
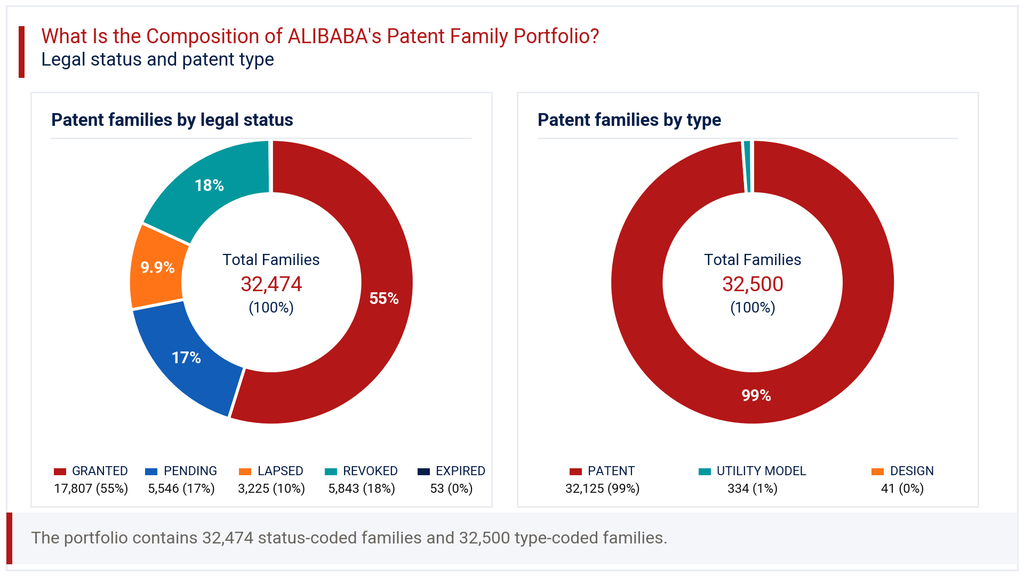
On the other side, 18.0% of families carry revoked status, and 9.9% have lapsed, while expired families are negligible at 0.2%. This revoked share deserves attention, since it signals meaningful attrition after grant or during opposition proceedings. Patent type data shows the portfolio is overwhelmingly utility patents, at 98.8%, with utility models and design rights forming a small minority. This mix suggests ALIBABA’s legal strategy centers on functional technical protection rather than design rights. The relatively high revoked share, paired with a strong grant rate, points to an aggressive filing posture that accepts some attrition as a cost of broad coverage.
How Has the ALIBABA Patent Portfolio Evolved Over Time?
Patent filing trends for ALIBABA show a long build-up followed by a sharp, data-related tail-off. Annual filings rose from just 255 families in the pre-2007 period to 1,351 by 2014, then climbed steadily. The portfolio reached 3,817 families in 2018, dipped slightly, then hit its peak of 4,185 in 2022. The filing-trend chart referenced in this section captures this rise-and-fall pattern across two decades.
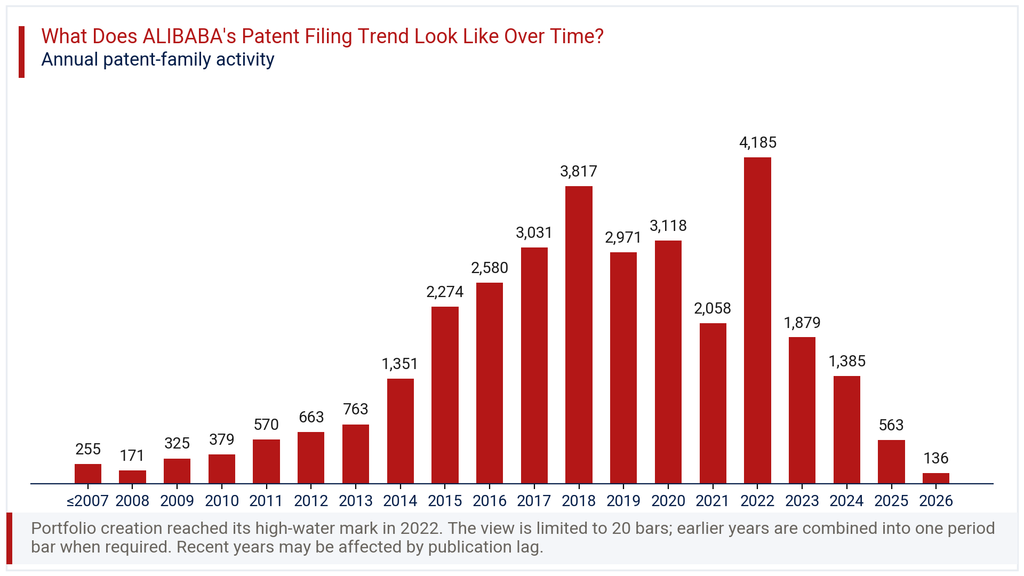
Filings fell to 1,879 in 2023 and further to 1,385 in 2024, with only 563 recorded for 2025 and 136 for 2026. The year-over-year change for the latest period shows a drop of 75.8%. This decline should not be read as a genuine pullback in research activity. Patent applications typically take 12 to 24 months to publish, so recent years remain understated in any live filing database. The true picture for 2024 through 2026 will likely firm up as records catch up, a standard pattern in patent filing trend analysis across most large filers.
Where Does the ALIBABA Patent Portfolio Prioritize Patent Protection?
Patent geography for ALIBABA is heavily concentrated at home. China accounts for 84.6% of all filings, equivalent to 27,482 families, dwarfing every other jurisdiction. This reflects the company’s core market and regulatory environment, where most of its commercial activity and revenue generation occurs. The geographic chart in this section makes the scale of this concentration immediately visible.
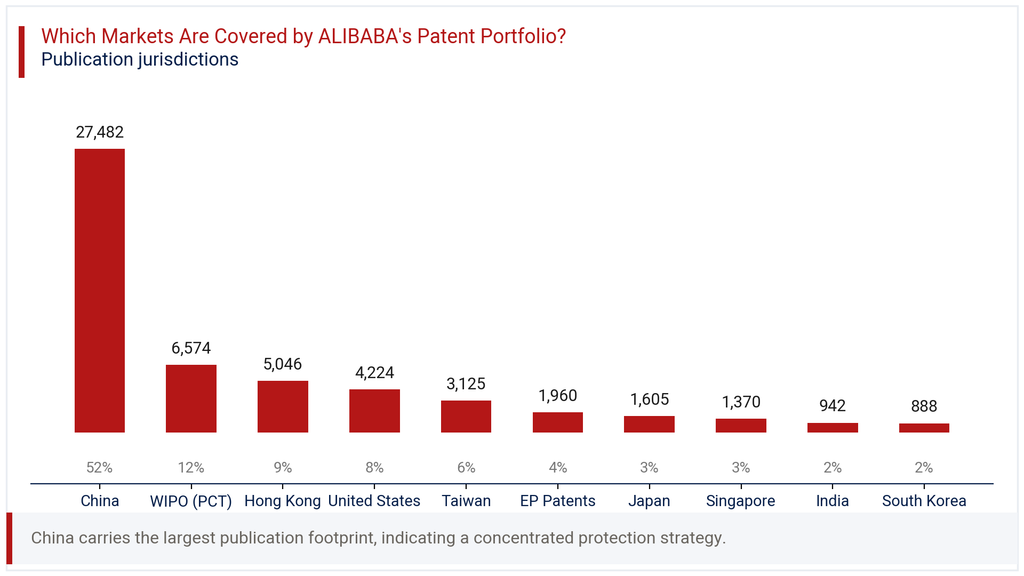
Beyond China, WIPO PCT filings represent 20.2% of the portfolio, a route companies use to preserve international filing options. Hong Kong follows at 15.5%, then the United States at 13.0%, and Taiwan at 9.6%. Europe, covered through EP Patents, holds 6.0%, while Japan, Singapore, India, and South Korea each represent smaller single-digit shares. This spread suggests a filing strategy built around a strong domestic core, supplemented by selective international protection in markets tied to commercial expansion. The modest India share, at 2.9%, indicates room for deeper protection as the company’s regional footprint grows.
Where is the ALIBABA Patent Portfolio Building Protection Across Key Technologies?
IPC analysis of the ALIBABA portfolio points squarely toward software and data technologies. G06F Digital Data Processing leads with 18,262 families, representing 43.2% of the entire portfolio. This single class outweighs the combined share of several other categories, confirming digital data processing as the company’s core technical focus. The technology chart in this section reflects just how dominant this single IPC class is.
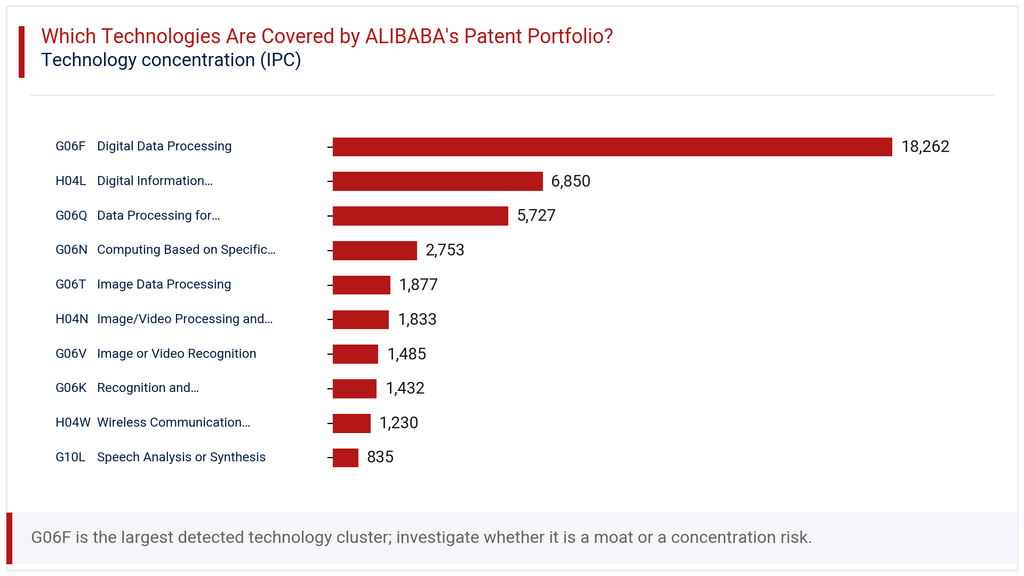
Communication and commercial data handling follow closely behind. H04L Digital Information Transmission holds 16.2% share with 6,850 families, while G06Q Data Processing for Administrative/Commercial Purposes accounts for 13.5% and 5,727 families. Emerging technology areas also show meaningful investment. G06N Computing Based on Specific Models, largely artificial intelligence methods, holds 6.5% share. Image and recognition technologies, including G06T, G06V, and G06K, together add further depth to computer vision capabilities. This technical spread aligns closely with Alibaba’s commercial focus on cloud computing, e-commerce platforms, and AI products like its Qwen model family.
How Has the ALIBABA Patent Portfolio Evolved Across Filing Geographies?
The heatmap in this section tracks how filing activity moved across jurisdictions between 2014 and 2023, revealing distinct phases. China filings grew from 1,169 in 2014 to a high of 3,321 in 2018, later touching 3,222 in 2022. This jurisdiction has consistently absorbed the largest share of annual filings throughout the period under review.
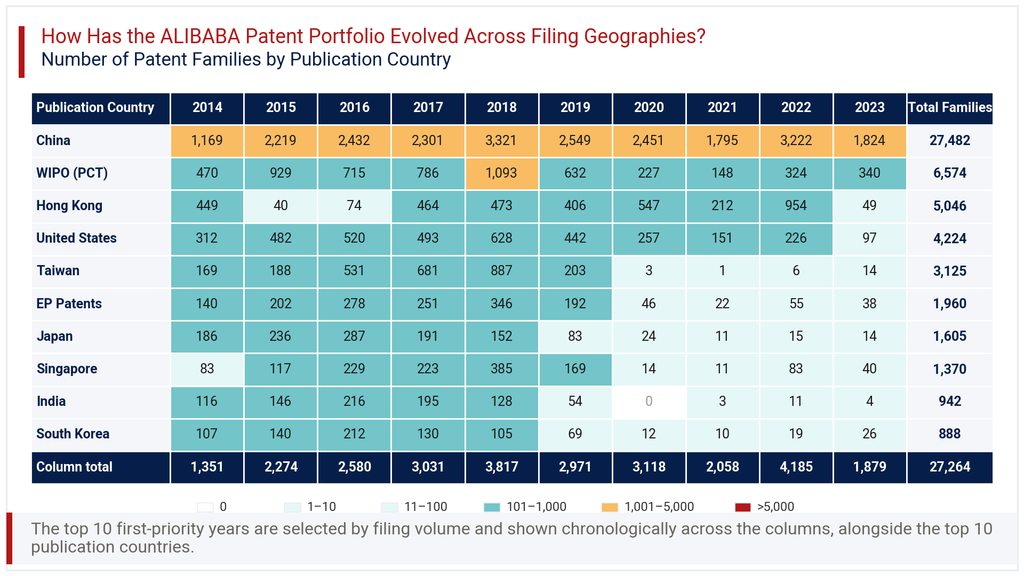
International jurisdictions followed a different trajectory. United States filings peaked at 628 in 2018 before falling steadily to just 97 by 2023. Taiwan shows an even sharper pattern, rising to 887 in 2018 then collapsing to near-zero by 2020 onward. Japan, India, and South Korea show similar contraction after 2018 and 2019, each falling to single or low double digits by 2023. Hong Kong stands apart, posting an unusual spike of 954 in 2022 after years of modest activity. This divergence suggests ALIBABA recalibrated its international filing strategy around 2019, pulling back from several secondary markets while sustaining its China-first approach.
Consultant’s Perspective on ALIBABA Patent Portfolio
From an advisory standpoint, the ALIBABA Patent Portfolio reflects a company whose intellectual property strategy mirrors its commercial priorities closely. The dominance of China filings, at 84.6%, is logical given Alibaba’s home-market depth, but it also signals limited international enforcement options outside a handful of jurisdictions. The technical concentration in digital data processing, cloud infrastructure, and AI-related classes like G06N aligns well with publicly known product directions, including Tongyi Qianwen and Alibaba Cloud.
The pullback in international filings after 2018, visible across Taiwan, Japan, India, and the United States, warrants closer monitoring. It could reflect a deliberate cost rationalization, a shift toward trade secret protection, or reduced expansion appetite in those specific markets. The 18.0% revoked share also merits a closer family-by-family review, particularly for patents considered commercially important. My recommendation is that any party assessing this portfolio for licensing, competitive benchmarking, or investment due diligence should pair these aggregate figures with targeted searches on specific technology families. Aggregate filing trends offer direction, but granular validation remains essential before drawing firm conclusions about competitive position or enforceability.
Explore Deeper Insights with Expertlancing Research
Patent filing numbers tell only part of the story. Understanding what they mean for competitive positioning, licensing opportunity, or technology risk requires deeper, family-level analysis. Expertlancing Research helps organizations move beyond aggregate counts into actionable patent intelligence, tailored to specific business questions. Whether you are evaluating a competitor, scouting technology partners, or preparing for a market entry decision, our analysts can build the detailed picture you need. Reach out to Expertlancing Research to commission a customized study on ALIBABA or any portfolio relevant to your strategy.