


The BOE Technology Patent Portfolio spans 68,153 patent families, with 67.7% classified as active across granted and pending stages. Of this total, 33,097 families have reached granted status, while 13,038 remain pending before patent offices. The grant rate stands at 48.6%, a useful marker of how many filed applications eventually clear examination. Meanwhile, 22,018 families fall into lapsed, revoked, or expired categories combined, reflecting the natural attrition seen in large, mature portfolios. These are prosecution and maintenance figures, not an assessment of patent quality or enforceability.
Filing activity peaked in 2019 with 5,772 families filed that year, pointing to a sustained period of aggressive protection building. China dominates the jurisdictional footprint, accounting for 99.0% of filings across a total of 10 jurisdictions tracked in this analysis. The leading technology cluster is G02F Optical Control Devices, covering 18,157 families, underscoring BOE’s core strength in display and optical control engineering. This concentration pattern offers an early signal of where the company has placed its heaviest research and development bets.
This report draws on patent filing and legal status records to map how BOE Technology has built and maintained its intellectual property position. Filing volume alone does not confirm commercial success, product adoption, or competitive superiority in the market. Readers evaluating specific technology areas or licensing opportunities should validate individual patent families before relying on them for business or legal decisions. What follows is a structured walk through the portfolio’s health, evolution, geography, and technology focus.
About BOE Technology
Company Profile: BOE Technology Group Co., Ltd. was founded in April 1993 in Beijing, China. The company describes itself as a leading IoT innovation company providing intelligent interface products and services for information interaction and human health. Its “1+4+N+eco-chain” business architecture is centered on Display and integrates four business groups: IoT Innovation, Sensors and Solutions, MLED, and MedTech and Healthcare. BOE is one of the world’s largest manufacturers of LCD, OLED and flexible displays.
Its products include LCDs, OLEDs, flexible displays, MicroLEDs, fingerprint sensors, optoelectronic sensors and solar panels. The company serves markets worldwide and is listed on the Shenzhen Stock Exchange. In 2023, BOE reported operating income of CN¥174.54 billion and total assets of CN¥419.19 billion. It employed 90,563 people in 2023. Chen Yanshun serves as Chairman of the company.
How Healthy is BOE Technology Patent Portfolio?
Patent portfolio health depends heavily on legal status distribution, and BOE’s numbers tell a fairly balanced story. Granted patents make up 48.6% of the total, the single largest category by legal status. Pending applications represent 19.1%, suggesting a steady pipeline still moving through examination. Lapsed families account for 18.0%, while revoked and expired families contribute 9.3% and 5.0% respectively. The composition chart in this section shows these proportions clearly across the full portfolio.
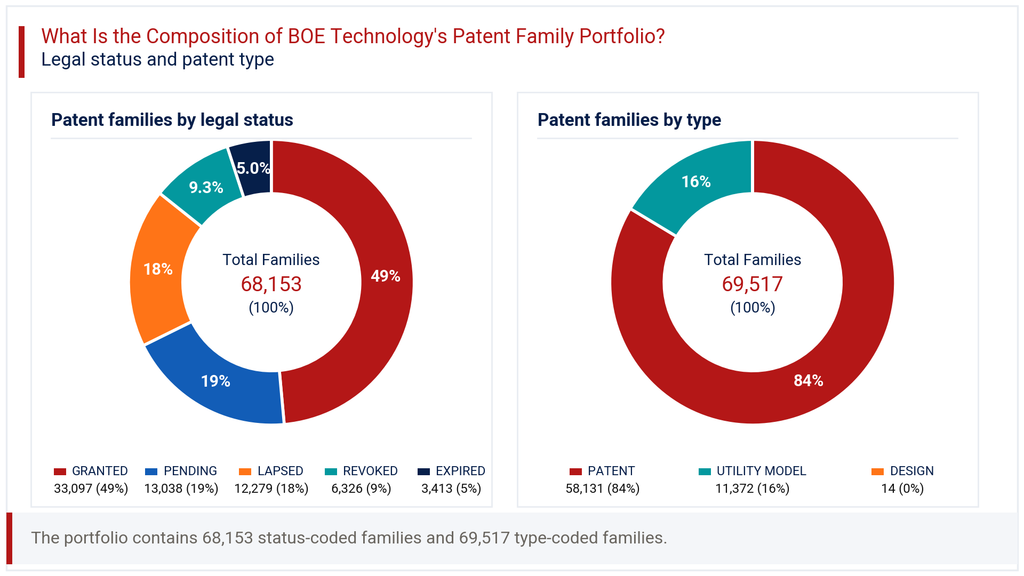
Looking at patent type, utility patents dominate at 83.6% of filings, with utility models at 16.4% and design patents forming a negligible 0.0% share. This heavy tilt toward utility patents, rather than utility models or design rights, points to a portfolio built around core technical inventions. The active rate of 67.7% combines granted and pending families, giving a reasonable picture of live protection. A grant rate of 48.6% is respectable for a portfolio of this scale and filing pace. Taken together, these figures suggest a portfolio that has matured without excessive erosion through lapses or revocations, though the lapsed and revoked share still warrants periodic review.
How Has the BOE Technology Patent Portfolio Evolved Over Time?
Patent filing trends at BOE show a clear growth arc from modest early activity to a sustained high-volume phase. Filings rose sharply from 1,106 in 2011 to 3,142 in 2013, then continued climbing to 5,772 by 2019, the peak year. Between 2016 and 2024, annual filings held consistently in the range of 5,400 to 5,772, indicating a stable, mature filing programme rather than a one-off surge. This plateau suggests BOE institutionalized a steady pace of innovation disclosure over nearly a decade.
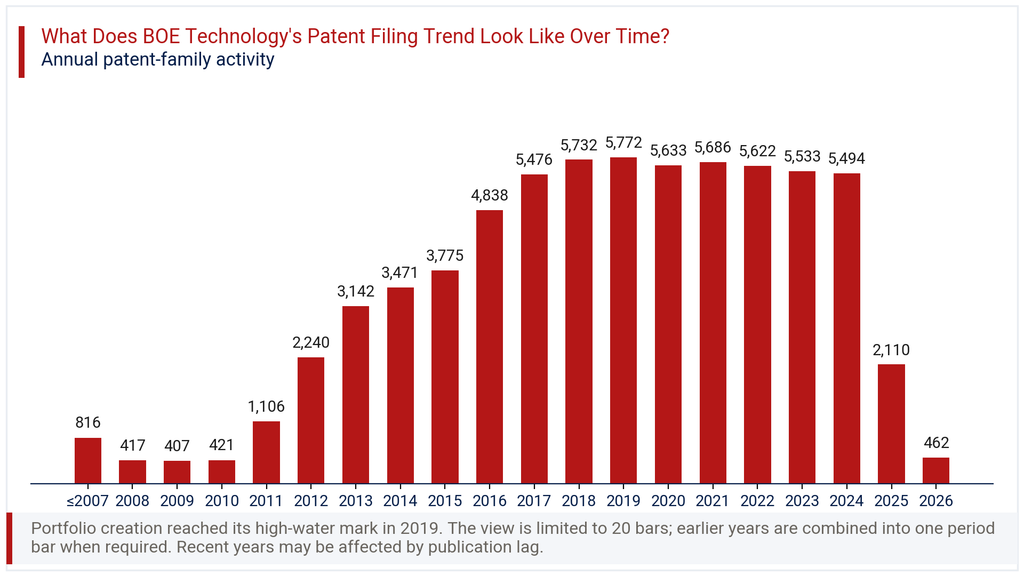
The filing-trend chart in this section shows a sharp fall in 2025 and 2026, with a -78.1% change in the latest year reflected in the data. This drop should not be read as a genuine slowdown in research output. Patent applications typically take 18 to 24 months to appear in public databases after filing, so recent years are structurally undercounted. The more meaningful signal lies in the decade of stability preceding this lag, which reflects consistent investment in protecting display and semiconductor innovations. Readers should treat the final two years as provisional rather than conclusive.
Where Does the BOE Technology Patent Portfolio Prioritize Patent Protection?
Patent geography within this portfolio is overwhelmingly concentrated in the home market. China accounts for 99.0% of all filings, a figure that reflects both the scale of BOE’s domestic manufacturing base and typical first-filing practice. The United States follows as the largest overseas jurisdiction at 37.1%, with WIPO PCT filings close behind at 33.1%, indicating a clear international filing strategy built on PCT applications before national phase entry.
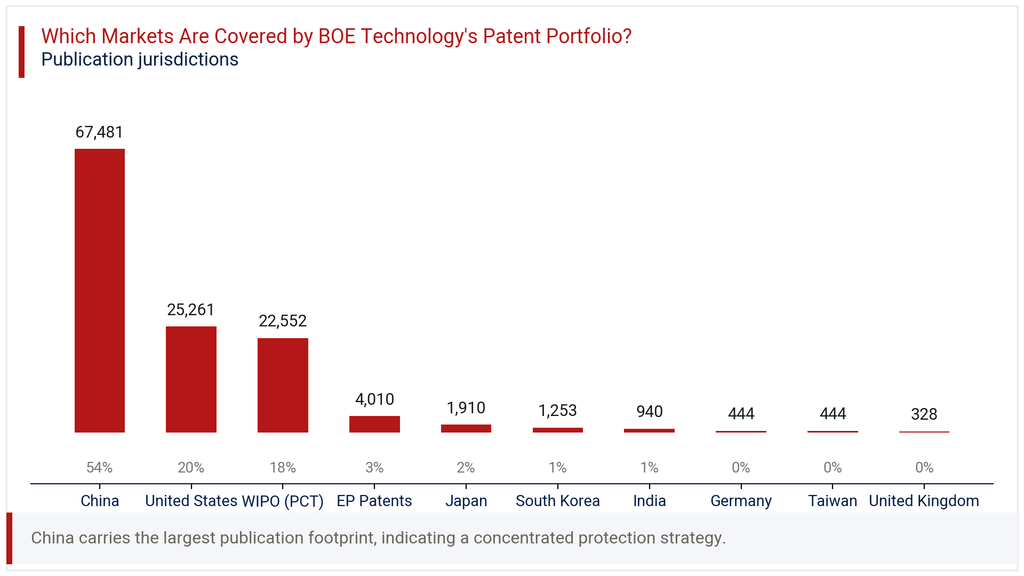
Beyond these top three, protection becomes noticeably thinner. European patents account for 5.9%, Japan for 2.8%, and South Korea for 1.8%. India, Germany, Taiwan, and the United Kingdom each sit below 1.5%, together rounding out the ten jurisdictions covered in this dataset. The geographic chart in this section illustrates this steep drop-off beyond China and the two leading international routes. This pattern suggests BOE prioritizes securing its domestic position first, then selectively extends coverage to the United States and through PCT channels where commercial exposure is highest. Markets like India and the UK appear to receive more opportunistic, lower-volume filing attention rather than systematic coverage.
Where is the BOE Technology Patent Portfolio Building Protection Across Key Technologies?
IPC analysis reveals a portfolio firmly anchored in display and semiconductor technology. The leading classification, G02F Optical Control Devices, covers 18,157 families and 21.4% of the total, making it the single largest technology concentration. H01L Semiconductor Devices follows with 15,248 families at 18.0%, and G09G Display Control ranks third with 13,571 families at 16.0%.
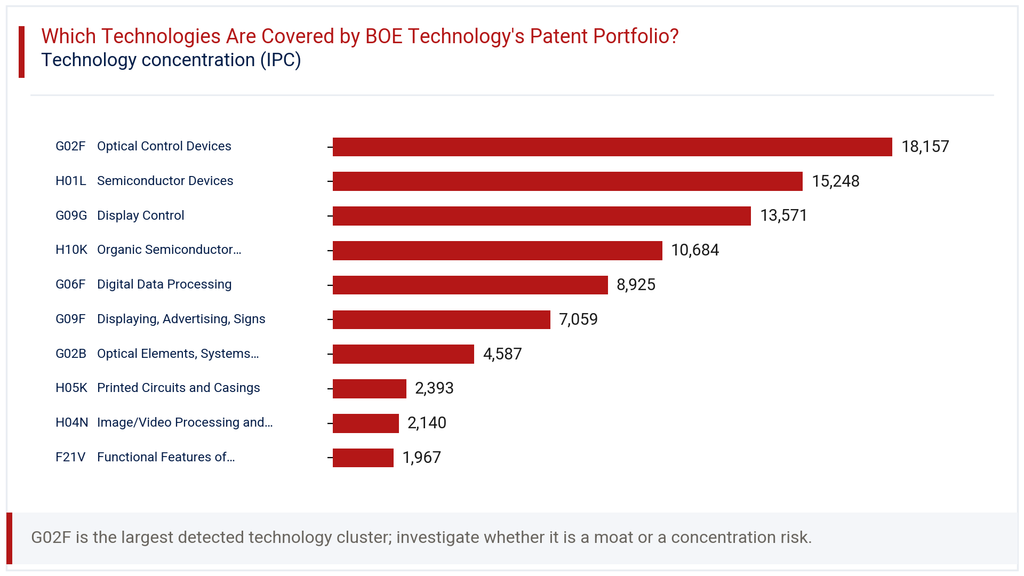
Organic semiconductor technology, captured under H10K, contributes 10,684 families at 12.6%, reflecting BOE’s continued push into OLED development. Digital data processing under G06F adds 8,925 families at 10.5%, suggesting integration between display hardware and processing logic. The technology chart in this section shows a clear hierarchy, with the top five IPC codes together accounting for the bulk of filings. Smaller clusters like F21V lighting features at 2.3% and H04N image processing at 2.5% round out a portfolio that is deep in display science but increasingly touches adjacent digital and optical disciplines.
How Has the BOE Technology Patent Portfolio Evolved Across Filing Geographies?
Viewing filing activity by year and jurisdiction together exposes patterns that aggregate figures miss. China’s filing volume stayed remarkably stable, moving from 3,767 in 2015 to 5,333 in 2024, consistently anchoring the overall portfolio. United States filings, by contrast, show visible volatility, peaking at 3,083 in 2017 before falling sharply to just 32 in 2024, a decline almost certainly tied to publication lag rather than an actual retreat from that market.
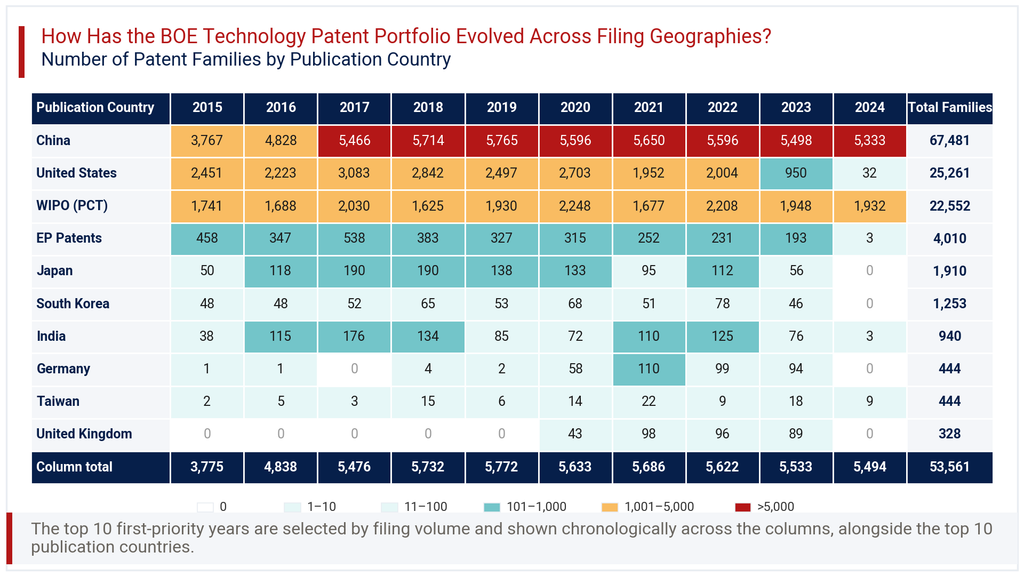
The heatmap in this section highlights similar patterns in smaller jurisdictions. Germany and the United Kingdom show near-zero activity before 2020, then a modest rise, with Germany reaching 110 filings in 2021 and the UK reaching 98 that same year. WIPO PCT filings remained comparatively steady throughout, ranging between 1,625 and 2,248 across the decade. This steadiness in PCT activity, even as individual national filings fluctuated, suggests BOE increasingly relies on PCT as a flexible staging mechanism before committing to specific national jurisdictions.
Consultant’s Perspective on BOE Technology Patent Portfolio
From an advisory standpoint, the BOE Technology Patent Portfolio reflects a company that has built depth before breadth. The domestic concentration at 99.0% is not unusual for a Chinese manufacturing giant, but it does mean overseas enforcement options remain comparatively narrow outside the US and PCT routes. A grant rate of 48.6% alongside an active rate of 67.7% indicates a portfolio in reasonably good standing, neither over-extended with stale pending applications nor hollowed out by excessive lapses.
The technology concentration around optical control, semiconductors, and display control confirms BOE’s core identity as a display manufacturer, with OLED and digital processing emerging as secondary but growing priorities. Businesses evaluating partnership, licensing, or competitive positioning against BOE should pay close attention to the H10K OLED cluster, given its scale and likely trajectory. The apparent filing decline in 2025 and 2026 deserves monitoring over the next 12 to 18 months, once publication lag clears, to confirm whether it signals a genuine pivot or simply a data visibility gap. Companies in adjacent display or semiconductor segments would benefit from tracking BOE’s jurisdictional choices closely, particularly any expansion beyond its current top three markets.
Explore Deeper Insights with Expertlancing Research
This analysis offers a starting point, not a complete picture. Businesses needing a deeper, validated view of BOE Technology’s filings, competitive technology mapping, or jurisdiction-specific risk assessment should consider a structured engagement. Expertlancing Research supports technology, legal, and strategy teams with custom patent intelligence tailored to specific business questions. Reach out to our research team to discuss how a focused study of this portfolio, or a comparable competitor set, can inform your next strategic or investment decision.