

The BYD patent portfolio spans 47,412 patent families, giving a clear picture of how this Chinese manufacturing group protects its technology. Of these families, 74.9% remain active, a figure that covers both granted and pending cases still within their legal lifespan. Granted families total 24,878, while 10,642 remain pending before patent offices. The grant rate stands at 52.5%, a reasonably strong conversion figure for a portfolio of this size. Lapsed, revoked and expired families together add up to 11,892. These are prosecution and maintenance metrics only, not a verdict on patent quality or enforceability.
Filing activity peaked in 2024, when BYD filed 7,552 patent families, the highest single-year count in the entire dataset. China dominates the jurisdictional spread, holding 98.4% share across a portfolio that reaches 10 jurisdictions worldwide. On the technology side, battery related innovation leads comfortably, with IPC class H01M (Batteries and Cells) accounting for 8,687 families, the largest cluster by far.
This article draws on structured patent filing data to describe how BYD has built and maintained its intellectual property position over time. Filing volume alone does not confirm commercial success, product adoption, or a lasting competitive edge in any given market. Readers using this analysis for diligence, licensing or competitive benchmarking should verify specific patent families directly before relying on them externally. What follows is a structured read of legal status, filing trends, geography and technology focus, intended to give a grounded starting point for deeper research.
About BYD
Company Profile: BYD Company Limited is a Chinese multinational manufacturing conglomerate. It is headquartered in Shenzhen, Guangdong, China. BYD was founded by Wang Chuanfu in February 1995 as a battery manufacturing company. It is a vertically integrated company with major subsidiaries, including BYD Auto, which produces automobiles, BYD Electronics, which produces electronic parts and assembly, and FinDreams, which makes automotive components and electric vehicle batteries.
Its largest subsidiary, BYD Auto, was established in 2003 and has become the world’s largest manufacturer of plug-in electric vehicles. Since 2009, BYD’s automotive business has accounted for over 50% of its revenue, surpassing 80% by 2023. The company reports revenue of around ¥804 billion in 2025, roughly US$112.78 billion, with production output exceeding 4.60 million vehicles that year. BYD’s new energy vehicle footprint spans more than 400 cities across over 70 countries and regions worldwide.
How Healthy is BYD Patent Portfolio?
The legal status composition chart shows a portfolio weighted toward granted protection, with 52.5% of families reaching grant. Pending applications make up 22.4%, a sizeable pipeline still moving through examination. Lapsed families account for 10.1%, expired ones for 9.5%, and revoked families for 5.5%. Combined, active cases, granted plus pending, cover 74.9% of the total portfolio, which signals reasonable upkeep discipline across a very large filing base.
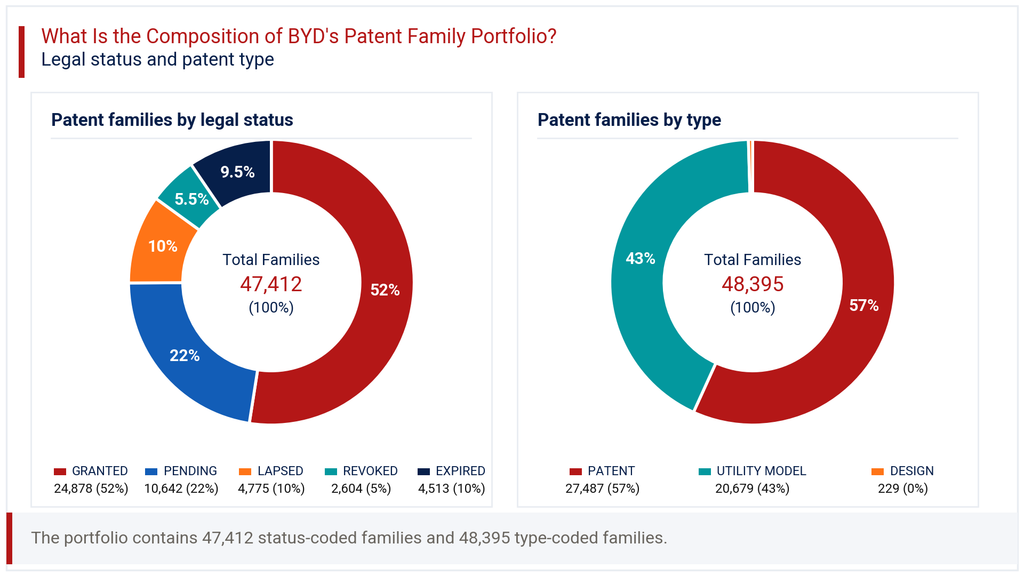
On patent type, utility models and standard patents split the portfolio in a fairly even way, at 56.8% and 42.7% respectively, with design filings a minor 0.5% share. This mix is typical for a Chinese manufacturer, since utility models offer faster, cheaper protection for incremental engineering improvements. The pattern suggests BYD treats utility models as a working tool for rapid product iteration, not just a formality. Taken together, the legal status picture points to an actively managed patent portfolio health position, with grant conversion that holds up well against typical industry benchmarks and a maintenance profile that is not overly bloated with dead filings.
How Has the BYD Patent Portfolio Evolved Over Time?
The filing trend chart tells a story of steady early activity followed by sharp acceleration. Annual filings sat in the 1,000 to 2,000 range through most of the 2010s, before climbing to 3,377 in 2022 and then surging to 5,522 in 2023. Filings hit their peak at 7,552 in 2024, nearly doubling the prior year’s count. This jump lines up closely with BYD’s rapid global expansion in electric vehicles and battery technology during that period.
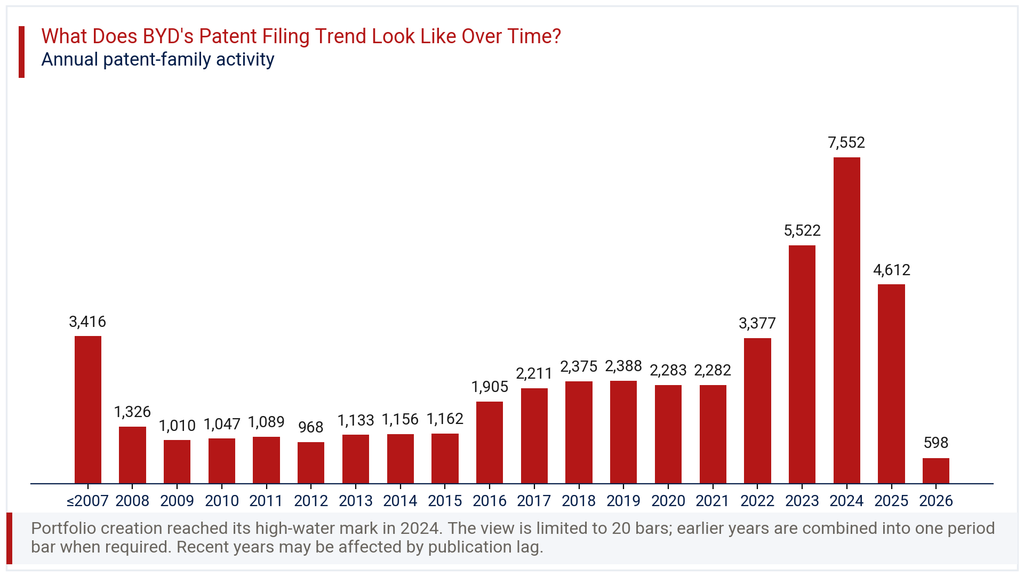
The 2025 count of 4,612 and the sharp fall to 598 in 2026 should not be read as a real retreat in filing activity. Patent applications typically take 12 to 18 months to publish, so the most recent one to two years in any filing dataset will always look artificially low. The -87% change reflected in the latest year figure is a publication lag effect, not a genuine drop in BYD patent filing trends. Viewed over the full decade, the trajectory is clearly upward, reflecting an organization investing more heavily in formal IP protection each year.
Where Does the BYD Patent Portfolio Prioritize Patent Protection?
The geographic chart confirms China as the overwhelming center of gravity, holding 98.4% of all filed families. This is consistent with a company whose manufacturing base, supply chain and primary customer market remain concentrated domestically. Beyond China, the WIPO PCT route carries 9.5% share, used as a bridge toward international filing decisions rather than a final destination.
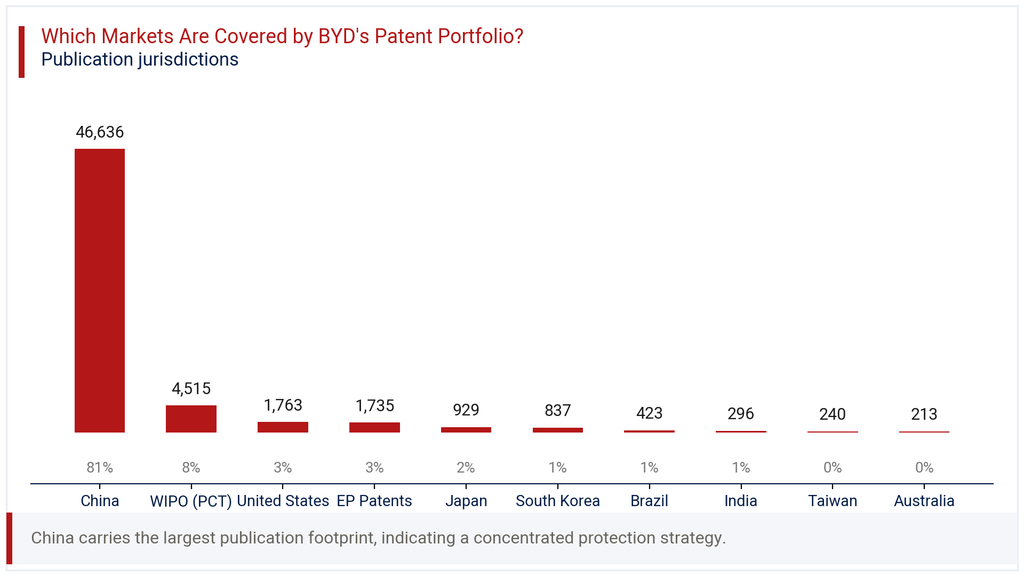
Direct national filings outside China remain modest in comparison. The United States holds 3.7%, EP Patents another 3.7%, Japan 2.0%, and South Korea 1.8%. Brazil, India, Taiwan and Australia each sit below 1% individually. This pattern in BYD’s patent geography suggests a company that protects its core innovation at home first, then selectively extends coverage to strategic export markets. The relatively thin international footprint, compared to China’s share, may warrant attention from competitors tracking BYD’s global market entry plans, since overseas filing often signals where commercial expansion is being planned next.
Where is the BYD Patent Portfolio Building Protection Across Key Technologies?
The technology chart in this section shows battery technology as the clear anchor of BYD’s IP strategy. IPC class H01M (Batteries and Cells) leads with 8,687 families, representing 30.7% of all classified filings. This scale of investment fits naturally with BYD’s identity as a battery manufacturer that expanded into vehicles, not the reverse.
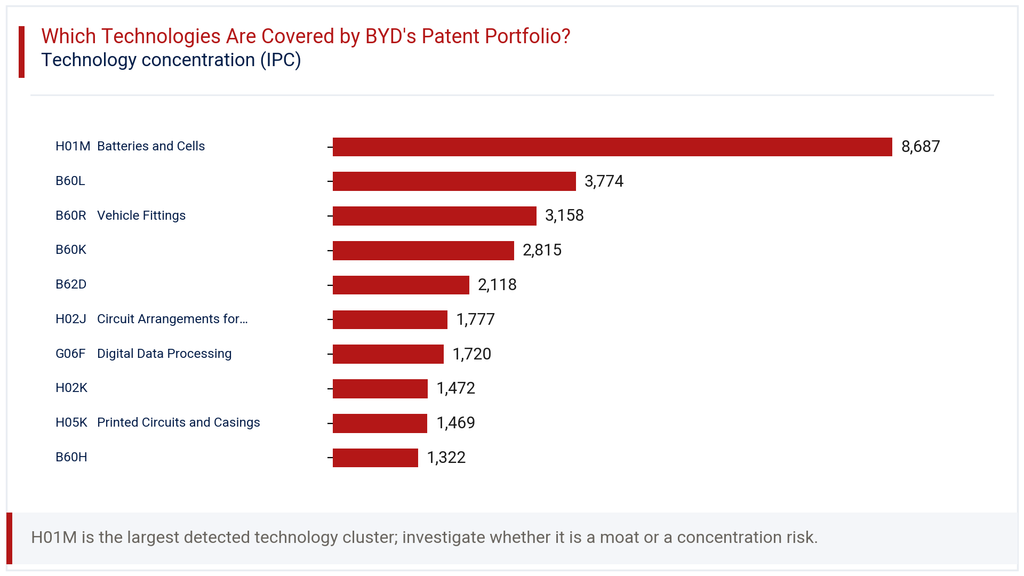
Vehicle-specific classes follow at meaningful distance. B60L (electric vehicle propulsion related) holds 3,774 families at 13.3% share, while B60R (Vehicle Fittings) adds 3,158 families at 11.2%. B60K contributes 2,815 families (9.9%) and B62D another 2,118 families (7.5%). Supporting clusters include power supply circuits under H02J at 6.3%, digital data processing under G06F at 6.1%, and printed circuits under H05K at 5.2%. This IPC analysis shows a portfolio built around a battery core, with surrounding layers of vehicle integration, power electronics and onboard computing. It is a coherent technology stack rather than scattered filing activity.
How Has the BYD Patent Portfolio Evolved Across Filing Geographies?
The heatmap view across years and jurisdictions adds useful texture to the geographic story. China’s filing volume rose from 1,872 in 2016 to a peak of 7,427 in 2024, tracking the overall portfolio trend closely. International filings, by contrast, show a distinct rise-and-fade pattern tied to specific years.
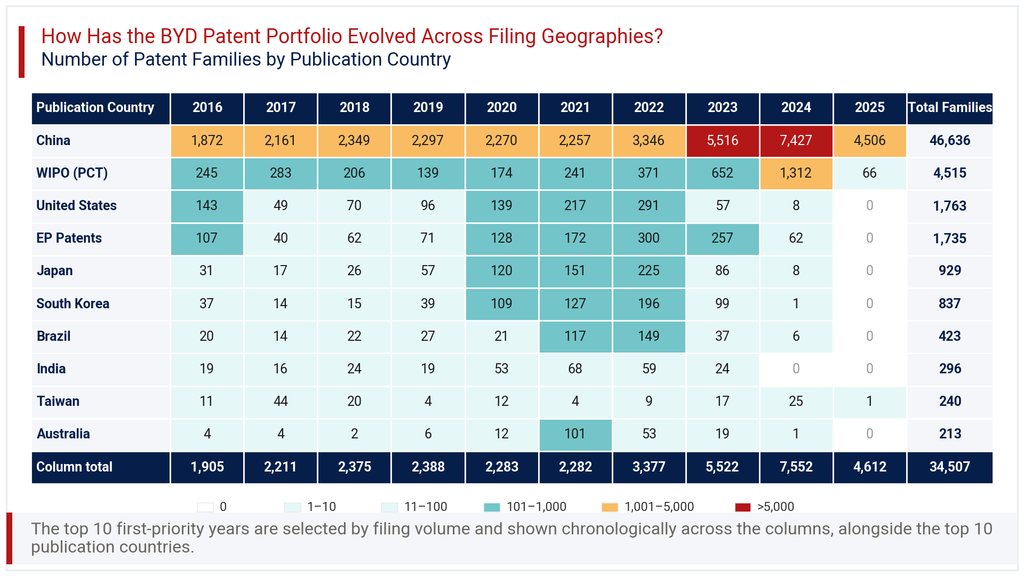
The United States peaked at 291 filings in 2022, then fell sharply to 57 in 2023 and just 8 in 2024. EP Patents followed a similar arc, from 300 in 2022 down to 62 in 2024. Japan and South Korea both peaked in 2022 as well, at 225 and 196 respectively, before tapering off. Australia saw a one-year spike of 101 filings in 2021, unusual against its otherwise low baseline. WIPO PCT filings, however, climbed strongly to 1,312 in 2024, suggesting BYD may be using the international route to delay national phase decisions while overseas strategy firms up, rather than scaling back global ambition.
Consultant’s Perspective on BYD Patent Portfolio
From an advisory standpoint, the BYD patent portfolio reads as a textbook case of domestic-first, technology-led IP building. The scale, 47,412 families, is not common even among large automotive or battery manufacturers, and the battery-centric technology concentration gives the portfolio a clear strategic core rather than a diffuse spread.
The softer overseas filing numbers in 2023 and 2024, particularly in the United States, Japan and EP jurisdictions, deserve a closer look rather than a surface read. Some of this reflects genuine filing lag given typical publication timelines. But it may also reflect a deliberate pause while BYD recalibrates its international patent strategy amid shifting trade and tariff conditions across key export markets. Companies evaluating BYD as a competitor, supplier or licensing partner should track whether WIPO PCT filings convert into national phase filings over the next two years.
For businesses benchmarking their own IP position against BYD, the message is straightforward: battery and power electronics protection sets the bar high, and catching up requires sustained, not sporadic, filing discipline. The BYD patent portfolio is a useful reference point for understanding how a vertically integrated manufacturer builds defensible technology positions at scale.
Explore Deeper Insights with Expertlancing Research
This analysis covers the headline patterns, but real business decisions need sharper detail. Expertlancing Research helps clients go deeper into specific technology clusters, competitor benchmarking, licensing risk and freedom-to-operate questions tied to portfolios like this one. Whether you are assessing a potential partner, tracking a competitor’s next move, or scoping a market entry, our team can build a tailored patent intelligence study around your exact question. Reach out to discuss what a focused engagement could uncover for your business.