

The CETC Patent Portfolio offers a useful window into how one of China’s largest state-owned technology groups builds and defends its intellectual property. Across 27,303 patent families, 71.8% remain active, counting both granted and pending matters. Of these, 12,059 patents stand granted and 7,552 remain pending before patent offices. The grant rate across the portfolio comes to 44.2%, while lapsed, revoked and expired cases together total 7,692. These figures describe prosecution and maintenance outcomes only, not the commercial strength or enforceability of any single patent.
Filing activity peaked in 2023 with 3,132 new families recorded that year, pointing to a long run-up in R&D output. China dominates the filing geography, accounting for 99.8% of all families across 10 jurisdictions tracked in this analysis. The leading technology cluster is G06F (Digital Data Processing), with 5,604 families, making it the single largest concentration of invention activity in the portfolio. This combination of scale and concentration tells a story worth unpacking section by section.
This report works from patent filing and legal status records to build a factual picture of CETC’s intellectual property activity. Filing volume alone does not confirm market success, product adoption or a lasting competitive edge. Readers using this analysis for diligence, licensing or competitive benchmarking should verify specific patent families independently before relying on them externally.
About CETC
Company Profile: China Electronics Technology Group Corporation (CETC) is a Chinese state-owned enterprise established on March 1, 2002, headquartered in Haidian District, Beijing. Its fields include communications equipment, computers, electronic equipment, IT infrastructure, networks, software development, research services, investment and asset management for civilian and military applications. It was founded with the stated goal of leveraging civilian electronics for the benefit of the People’s Liberation Army.
The company reports products including radars, unmanned aerial vehicles, electronic equipment, telecommunications equipment, software and internetworking solutions. According to Wikipedia, CETC employs around 150,000 people and is wholly owned by the Central People’s Government. Its revenue reached 220,427,000,000 renminbi in 2018. In 2021, CETC became the third largest electronics and IT company in China after absorbing Potevio, with combined 2019 revenue of $53 billion. The group operates worldwide, serving both civilian and defence sectors.
How Healthy is CETC Patent Portfolio?
Patent portfolio health depends on how many filings convert to grants and how many stay enforceable over time. Within the CETC Patent Portfolio, 44.2% of families have reached granted status, against 27.7% still pending examination. Lapsed cases make up 13.5%, revoked cases 12.7%, and expired matters a smaller 2.0% share. Put together, the active rate across granted and pending cases stands at 71.8%, a reasonably strong figure for a portfolio of this size.
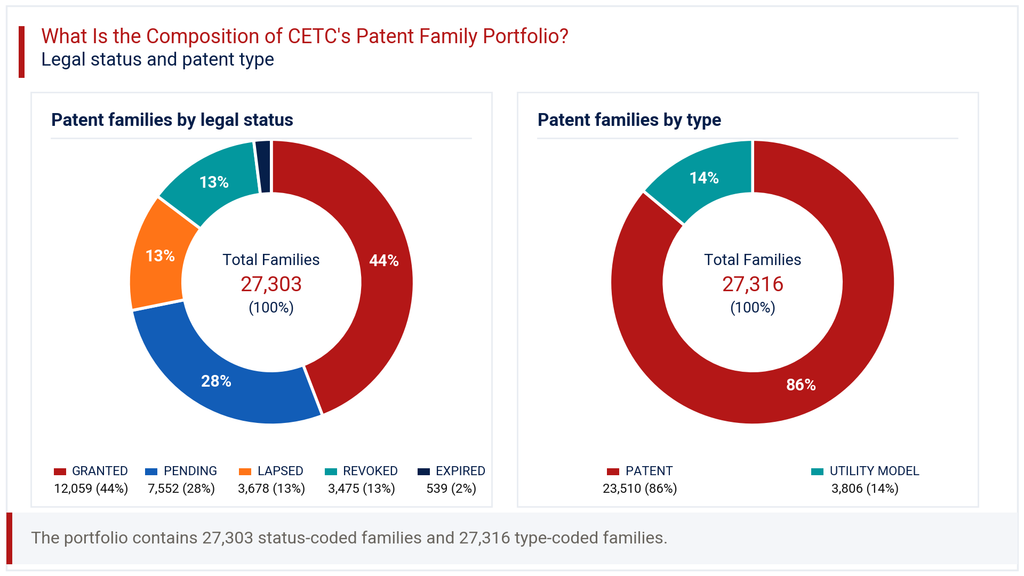
The composition chart in this section also shows a clear tilt toward full patents over utility models. Standard patents account for 86.1% of filings, compared to 13.9% for utility models. This mix suggests CETC generally pursues deeper technical protection rather than quicker, shorter-term utility filings. The sizeable revoked and lapsed share, however, signals that a meaningful portion of older filings has not survived renewal or opposition. For a portfolio this large, that outcome is not unusual, but it does mean overall patent legal status should be read family by family for any serious valuation or licensing exercise, not taken as a single aggregate number.
How Has the CETC Patent Portfolio Evolved Over Time?
Patent filing trends for CETC show a long, steady climb followed by a sharp recent run-up. Filings moved from 169 in the pre-2008 window to 794 by 2013, then kept rising through 1,536 in 2019. The steepest increase came between 2020 and 2023, when annual filings rose from 1,953 to a peak of 3,132, the highest point in the entire filing-trend chart. That four-year stretch marks the most intense period of invention disclosure in the company’s recorded history.
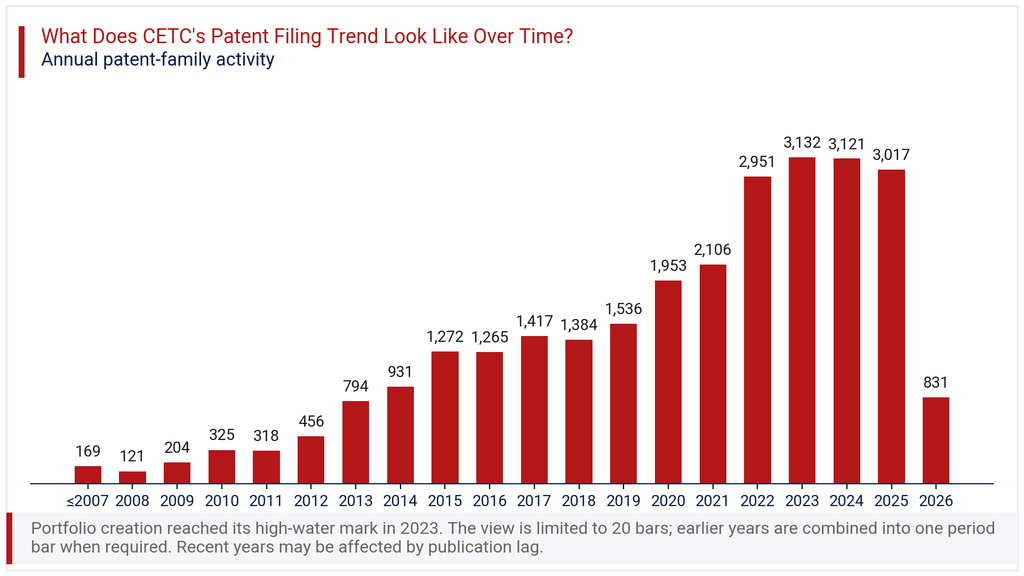
Filings held near peak levels in 2024 at 3,121 before data shows 3,017 in 2025 and a sharp drop to 831 in 2026. The latest annual change recorded is a fall of 72.5%. This should not be read as a genuine collapse in research output. Patent applications typically take many months to appear in public databases, so the most recent one to two years almost always understate true filing activity. The real trend only becomes clear once publication catches up, usually after eighteen to twenty-four months.
Where Does the CETC Patent Portfolio Prioritize Patent Protection?
Patent geography within this portfolio is heavily concentrated in a single market. China accounts for 99.8% of all filings, a figure that leaves very little room for other jurisdictions. The geographic chart in this section lists nine other territories, but each holds a fractional share by comparison. WIPO PCT filings come next at 1.5%, followed by the United States at 0.8% and EP Patents at 0.2%.
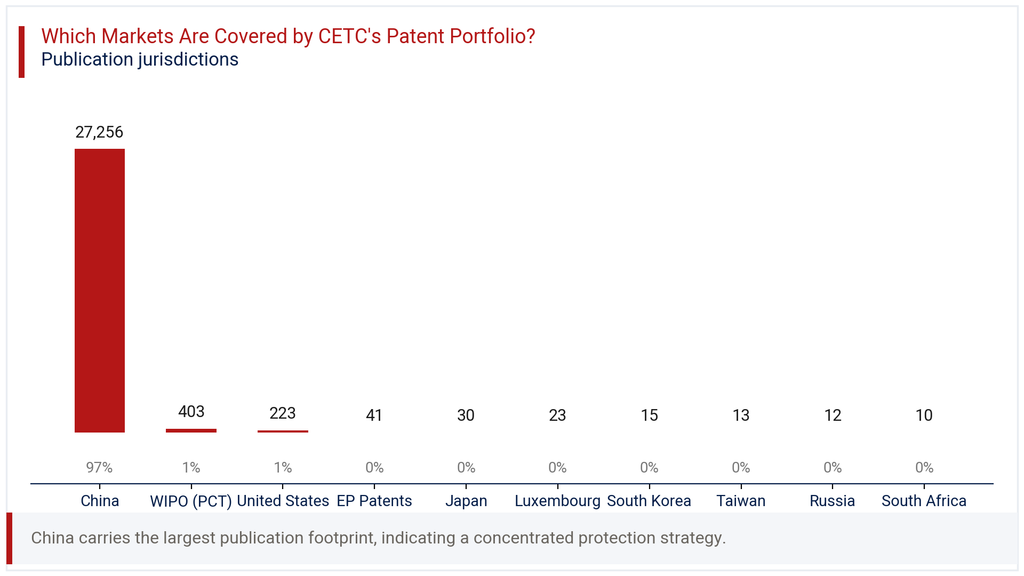
The remaining jurisdictions, Japan, Luxembourg, South Korea, Taiwan, Russia and South Africa, together add up to a handful of families each. This pattern is typical of a state-linked enterprise whose primary commercial and strategic mandate sits within its home market. The limited PCT and US presence suggests CETC has not prioritized broad international enforcement to the same degree as its domestic filing strategy. Any buyer or partner evaluating cross-border freedom-to-operate should treat this concentration as a central finding, not a side note, when assessing the CETC Patent Portfolio for licensing or acquisition purposes.
Where is the CETC Patent Portfolio Building Protection Across Key Technologies?
IPC analysis of the portfolio points to digital data processing as the dominant technical theme. G06F (Digital Data Processing) leads with 5,604 families, or 29.6% of classified filings. H04L (Digital Information Transmission) follows with 2,441 families at 12.9%, and G06N (Computing Based on Specific Models) sits third with 2,010 families at 10.6%. These three classes alone cover more than half the portfolio’s technical footprint.
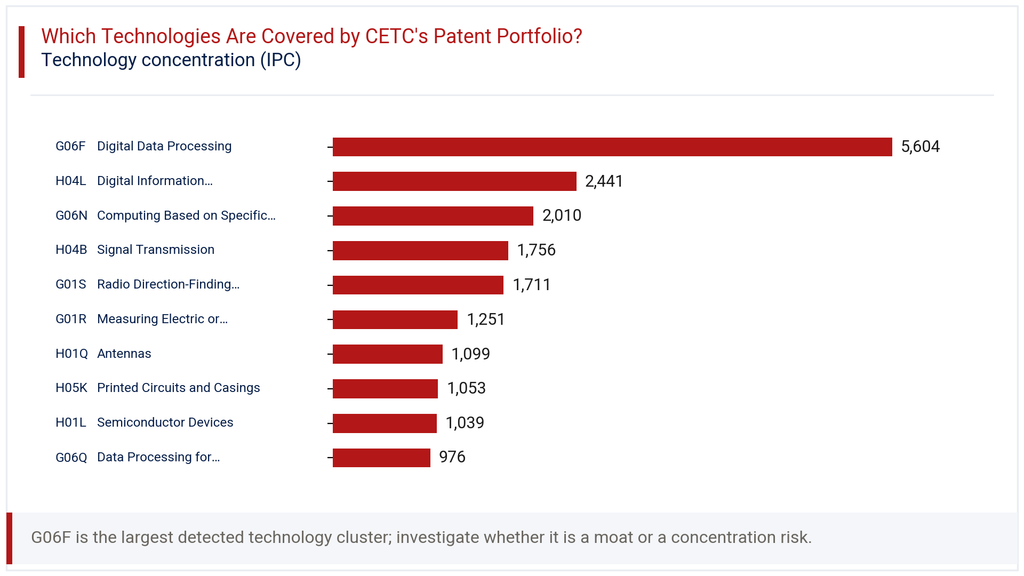
The technology chart in this section also highlights strength in signal and sensing domains. H04B (Signal Transmission) holds 9.3% share, while G01S (Radio Direction-Finding, Navigation) accounts for 9.0%, both consistent with CETC’s radar and communications equipment lines. Antennas (H01Q), printed circuits (H05K) and semiconductor devices (H01L) each contribute between 5.5% and 5.8%. This spread shows a portfolio built around core electronics and computing infrastructure, with growing weight toward software-adjacent fields like data processing and AI-related computing models rather than purely hardware-based invention.
How Has the CETC Patent Portfolio Evolved Across Filing Geographies?
The heatmap view of filings by year and jurisdiction confirms that China has driven almost all portfolio growth since 2016. Domestic filings rose from 1,270 in 2016 to 3,130 in 2023, tracking closely with the portfolio’s overall filing trend. Other jurisdictions moved in much smaller, less consistent patterns across the same period.
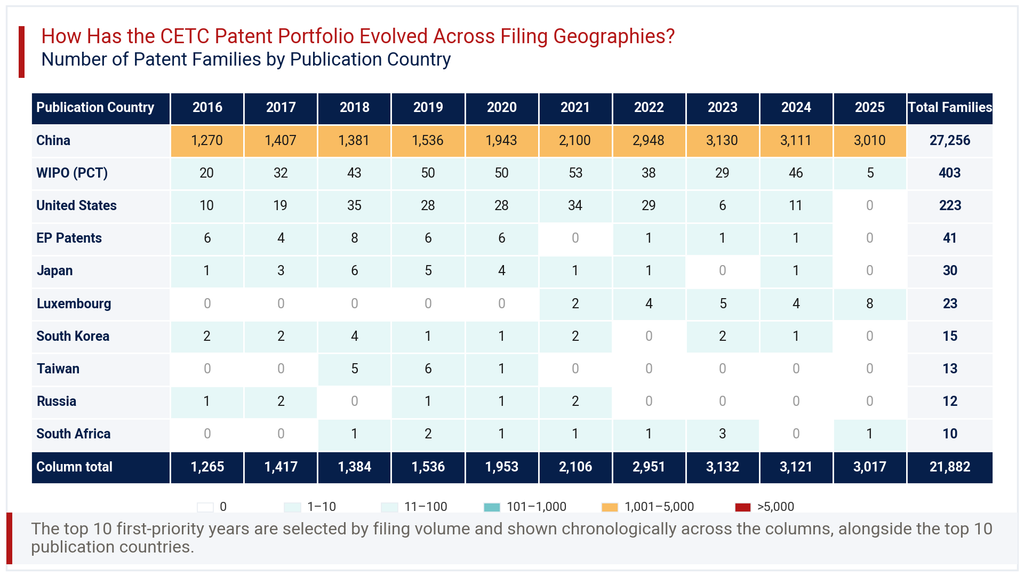
WIPO PCT filings rose gradually from 20 in 2016 to a high of 53 in 2021, before declining to 29 in 2023. United States filings peaked at 35 in 2018 and fell sharply to 6 by 2023. EP Patent filings nearly stopped after 2021, recording just 1 filing in several recent years. Interestingly, Luxembourg shows a small but rising pattern, from 0 filings before 2021 to 8 in 2025, a detail worth watching. Taken together, the year-by-jurisdiction data confirms that international filing has become more selective over time, even as domestic Chinese filing activity has expanded considerably.
Consultant’s Perspective on CETC Patent Portfolio
From an advisory standpoint, the CETC Patent Portfolio reflects a classic state-enterprise filing pattern: high domestic volume, low international spread. The 99.8% China concentration, paired with a 44.2% grant rate, suggests a portfolio built primarily for domestic defensive coverage and internal technology documentation rather than global licensing revenue. That is a reasonable strategy given CETC’s mandate serving both civilian and defence sectors domestically.
The technology concentration around G06F, H04L and G06N signals a clear pivot toward computing, data transmission and AI-adjacent innovation, alongside legacy strength in radar and signal systems. This dual focus positions CETC well for domestic digital infrastructure programs. However, the thin international footprint, under 1% combined outside China and WIPO filings, limits the portfolio’s relevance for partners seeking enforceable rights in Western markets.
Organizations evaluating CETC for competitive benchmarking, supply chain risk or technology licensing should focus due diligence on the top IPC clusters and verify legal status for any family under consideration. Given the recent filing dip likely tied to publication lag, re-checking filing counts for 2025 and 2026 in twelve months would offer a clearer read on current research direction.
Explore Deeper Insights with Expertlancing Research
This overview only scratches the surface of what the CETC Patent Portfolio reveals about competitive positioning in Chinese electronics and defence technology. Expertlancing Research helps clients go deeper, from family-level legal status verification to technology mapping against named competitors. If your team needs sharper intelligence for licensing, M&A diligence or R&D benchmarking, our analysts can build a tailored study around your specific question. Reach out to Expertlancing Research to discuss a custom patent intelligence engagement suited to your business needs.