

The China Electronics Corporation Patent Portfolio offers a useful lens into how one of China’s largest state-owned telecom and electronics groups has built its intellectual property position. Across its filing history, the company holds 12,684 patent families, of which 72.4% remain active when granted and pending cases are combined. Of these, 5,741 families have been granted and 3,446 remain pending before patent offices. The grant rate stands at 45.3%, while 3,497 families fall into lapsed, revoked, or expired status combined. These figures describe prosecution and maintenance activity only, not a judgment on patent quality or enforceability.
Filing activity peaked in 2024, when the company recorded 1,497 new families, capping a decade of sustained growth. China dominates the filing strategy, accounting for 99.7% of all filings across 10 jurisdictions tracked in this portfolio. The leading technology cluster is G06F, Digital Data Processing, with 2,791 families, well ahead of every other classification. This concentration signals where CEC has placed its heaviest research and filing bets over the years.
This report draws on patent family counts, legal status, jurisdiction spread, and technology classification to build a picture of CEC’s filing behavior. Filing volume alone does not confirm commercial success, product deployment, or competitive strength in any given market. Readers considering business decisions based on these patterns should independently verify specific patent families before relying on them externally.
About China Electronics Corporation
Company Profile: China Electronics Corporation, known as CEC, is a Chinese state-owned enterprise founded in 1989. It is one of the largest producers of telecom equipment in China for both civilian and military purposes. The company is headquartered at CEC GreatWall Tower A in Shenzhen, Guangdong. Its core offerings span computer software and enterprise software applications. In 2007, CEC acquired the mobile phone division of Philips, which at the time had annual revenue of 400 million euros and 240 employees. For 2017, the company is listed with revenue of CN¥216.21 billion and net income of CN¥4.25 billion. CEC operates under full ownership of the People’s Republic of China. The United States Department of Defense published the names of companies with links to the People’s Liberation Army operating directly or indirectly in the United States, and CEC was included on the list.
This reflects continued scrutiny of its military-linked operations alongside its civilian electronics business.
How Healthy is China Electronics Corporation Patent Portfolio?
Patent portfolio health depends heavily on legal status distribution, and CEC’s numbers tell a mixed story. Granted patents make up 45.3% of the total, while pending applications represent 27.2%, pointing to a sizeable pipeline still under examination. Combined, these active categories bring the overall active rate to 72.4%, a reasonably strong figure for a portfolio of this scale. The composition chart in this section shows this split clearly across all five legal status categories tracked.
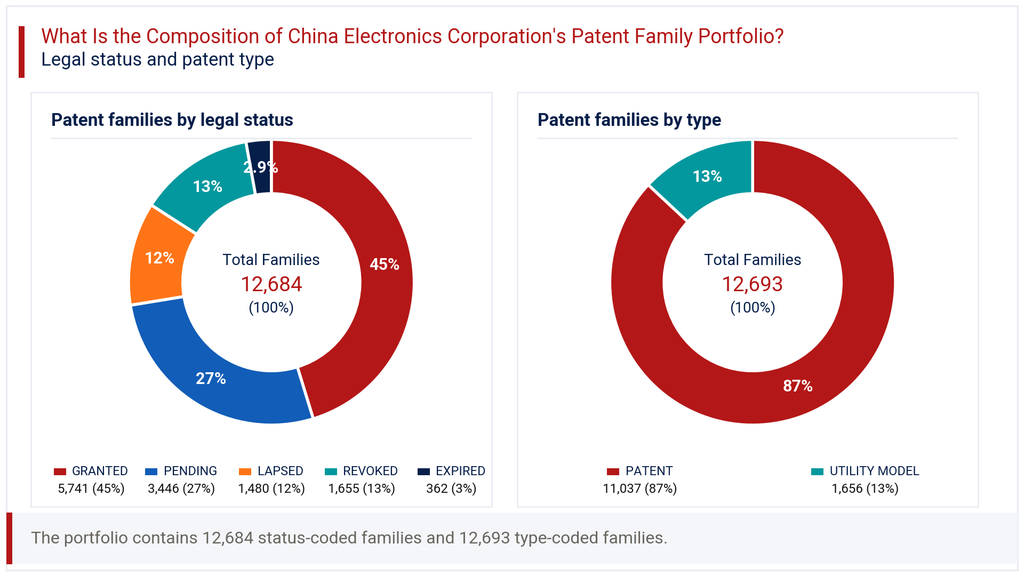
On the weaker side, 11.7% of families have lapsed and 13.0% have been revoked, while 2.9% have expired naturally. Revocations at this level deserve attention, since they often reflect validity challenges or examination hurdles rather than routine attrition. Looking at patent type, traditional patents account for 87.0% of filings against 13.0% utility models, a split that favors higher-value protection. This mix suggests CEC pursues substantive invention protection more than incremental utility filings, a pattern typical of larger state-backed technology groups building long-term patent portfolio health.
How Has the China Electronics Corporation Patent Portfolio Evolved Over Time?
Patent filing trends for CEC show a long, steady climb followed by a sharp acceleration after 2017. Annual filings grew from just 104 families in the period up to 2007 to 613 in 2017, then more than doubled by 2020 to 1,074. The filing trend chart in this section traces this build-up year by year, highlighting consistent upward momentum across nearly every reporting period.
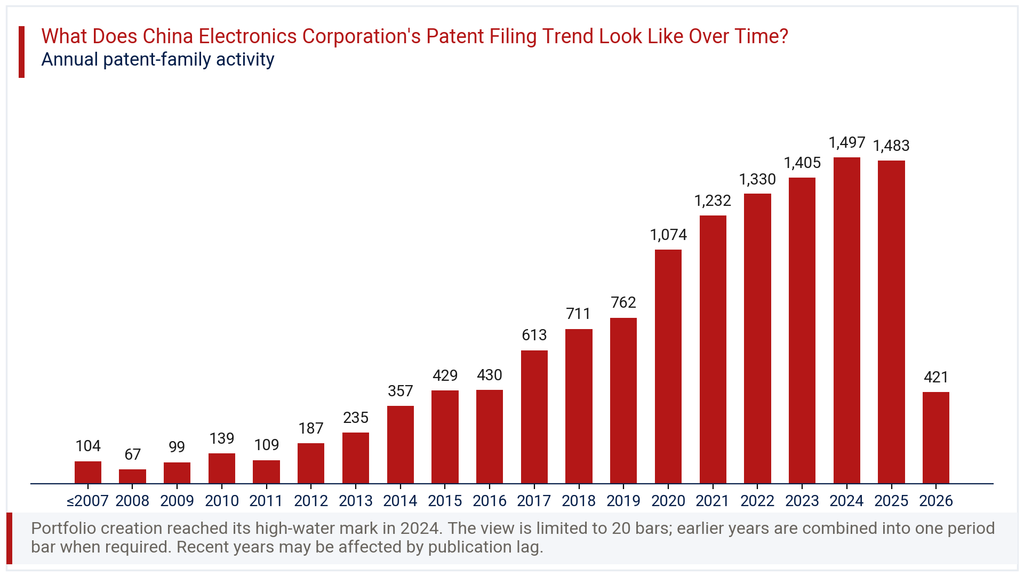
Growth continued through 2021 (1,232), 2022 (1,330), 2023 (1,405), and peaked at 1,497 in 2024. The following year recorded 1,483 families, essentially flat against the peak, while 2026 shows just 421, a drop reflected in the -71.6% latest year change figure. This decline is best read as publication lag rather than a genuine pullback, since recently filed applications often take months or years to appear in public patent records. The overall trajectory still points to a portfolio in active expansion mode through the most recently completed filing years.
Where Does the China Electronics Corporation Patent Portfolio Prioritize Patent Protection?
Patent geography for CEC is overwhelmingly domestic. China accounts for 99.7% of all filings, underscoring a portfolio built primarily to protect the company’s home market position. The geographic chart in this section shows how thin international filing remains by comparison, with every other jurisdiction registering under 3% share.
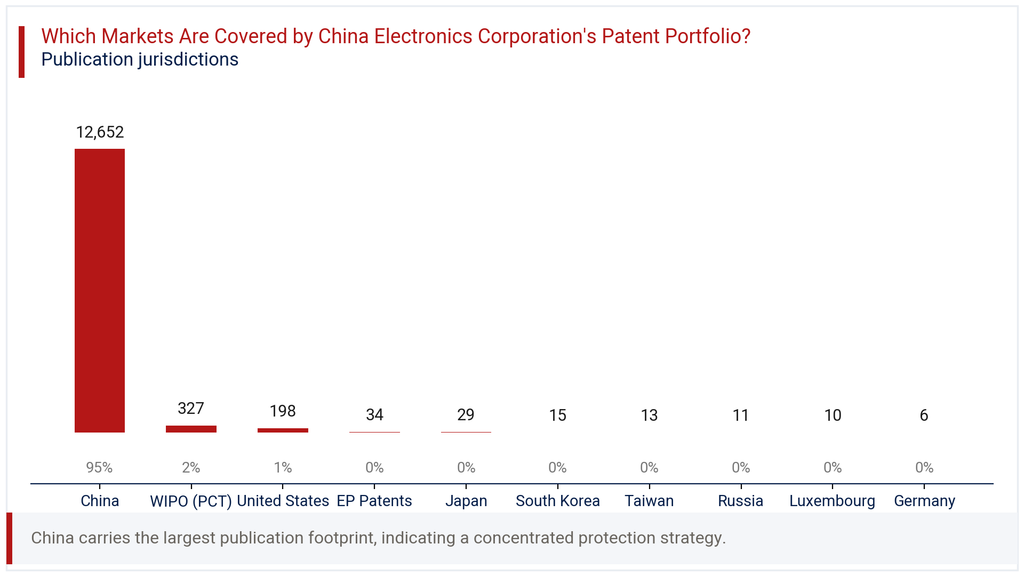
WIPO PCT filings reach 2.6%, serving as the main bridge toward potential international protection, followed by the United States at 1.6%. European Patents, Japan, South Korea, Taiwan, Russia, Luxembourg, and Germany each contribute marginal volumes, together covering 10 jurisdictions in total. This pattern is common among Chinese state-owned technology groups whose commercial priorities center on domestic telecom and electronics markets. It also suggests that international competitors face relatively limited direct patent exposure from CEC outside China, though monitoring PCT and US filing activity remains worthwhile given their role as early signals of expansion intent.
Where is the China Electronics Corporation Patent Portfolio Building Protection Across Key Technologies?
IPC analysis of the CEC portfolio reveals a clear concentration around digital and computing technologies. G06F, Digital Data Processing leads with 2,791 families, representing 30.7% of all classified filings. H04L, Digital Information Transmission follows at 12.7%, and G06N, Computing Based on Specific Models accounts for 11.1%. The technology chart in this section lays out all ten leading classifications side by side.
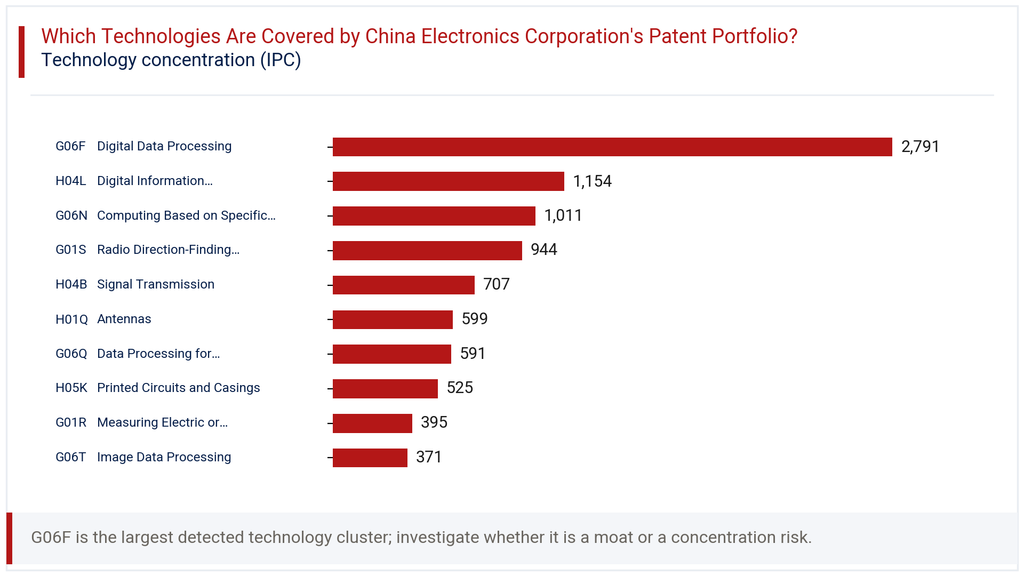
Further down, G01S, Radio Direction-Finding and Navigation holds 10.4%, while H04B, Signal Transmission and H01Q, Antennas contribute 7.8% and 6.6% respectively. Rounding out the picture are G06Q, Data Processing for Administrative or Commercial Purposes at 6.5%, H05K, Printed Circuits and Casings at 5.8%, G01R, Measuring Electric or Magnetic Variables at 4.3%, and G06T, Image Data Processing at 4.1%. This spread shows a portfolio anchored in computing and data processing, with meaningful depth in communications and signal-related hardware supporting CEC’s telecom equipment business.
How Has the China Electronics Corporation Patent Portfolio Evolved Across Filing Geographies?
The heatmap view of filings by year and jurisdiction confirms China’s dominant and growing share of CEC’s output. Domestic filings rose from 430 in 2016 to 1,495 in 2024, tracking almost exactly with the company’s overall filing trend. International jurisdictions, by contrast, never scaled in proportion, even during years of strong domestic growth.
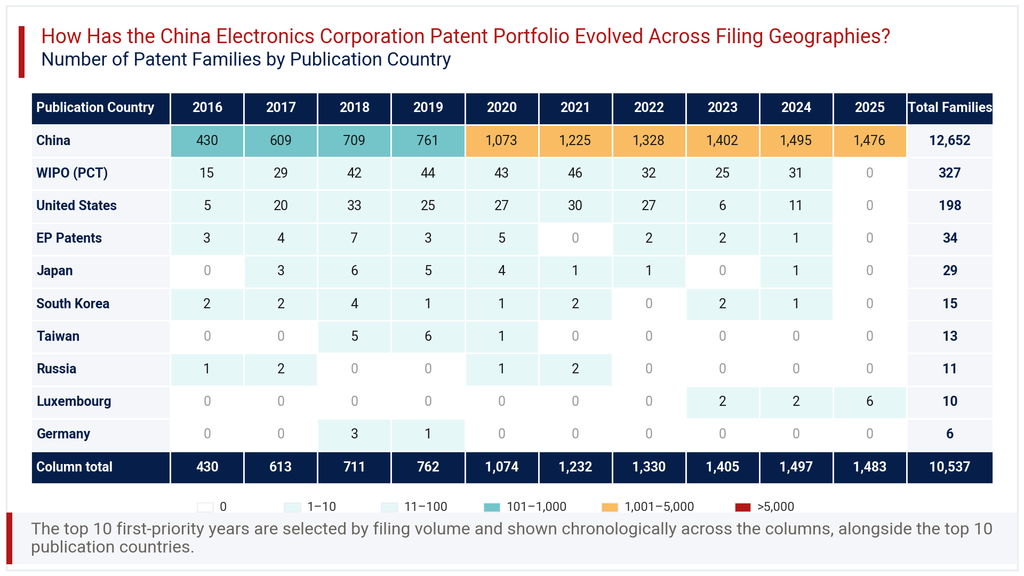
US filings peaked at 33 in 2018 before falling to just 6 by 2023 and 11 by 2024. WIPO PCT filings followed a similar arc, rising to 46 in 2021 then easing to 31 by 2024. Smaller jurisdictions like Japan, Taiwan, and Russia show sporadic single-digit activity with no sustained pattern. Luxembourg stands out as a recent and narrow exception, appearing only from 2023 onward and reaching 6 filings in 2025. This geographic evolution reinforces that CEC’s patent strategy remains firmly China-centric, with international filing treated as a secondary, selectively applied activity.
Consultant’s Perspective on China Electronics Corporation Patent Portfolio
Taken as a whole, the China Electronics Corporation Patent Portfolio reflects a state-backed technology group scaling its domestic patent base aggressively while keeping international exposure deliberately limited. The jump from roughly a hundred annual filings in the pre-2008 period to nearly 1,500 by 2024 signals sustained investment in formal IP protection, likely tied to China’s broader push for domestic innovation metrics. The heavy tilt toward G06F and communications-related classes aligns well with CEC’s stated focus on telecom equipment and enterprise software.
What stands out is the gap between filing scale and international reach. With 99.7% of filings concentrated in China, the portfolio currently offers limited direct leverage in overseas markets, despite CEC’s documented international acquisitions history. The relatively elevated revocation rate of 13.0% also warrants closer review of patent quality within the granted set, rather than relying on volume alone as a strength indicator. Organizations assessing CEC as a competitor, licensing partner, or acquisition target should treat these filing patterns as a starting point. A deeper, family-level review of granted claims and jurisdictional coverage would be necessary before drawing firm competitive conclusions.
Explore Deeper Insights with ExpertLancing Research
This overview only scratches the surface of what CEC’s patent activity can reveal. ExpertLancing Research helps technology companies, investors, and legal teams go further, with family-level patent analysis, competitive benchmarking, and custom technology landscape studies. If you are evaluating CEC as a competitor, partner, or acquisition target, our research team can build a tailored assessment around your specific business question. Reach out to discuss how a deeper patent intelligence engagement could support your next strategic decision.