

The China Resources Patent Portfolio spans 11,187 patent families, offering a useful lens into how this diversified conglomerate channels its research efforts. Of this total, 70.8% remains active today, combining both granted and pending filings. The portfolio counts 5,644 granted patents alongside 2,279 pending applications, producing a grant rate of 50.5%. The remaining families fall into lapsed, revoked or expired categories, totalling 3,264 filings. These figures describe prosecution and maintenance status only, not the legal strength or commercial value of any single patent.
Filing activity peaked in 2024, when the company recorded 1,582 new families, marking its strongest year on record. China dominates the geographic footprint, accounting for 99.2% of all filings across 10 jurisdictions tracked in this analysis. On the technology side, G01N (Investigating or Analysing Materials) leads the portfolio with 898 families, reflecting a strong emphasis on materials testing and analytical instrumentation across the group’s diverse business lines.
This report works through legal status, filing trends, jurisdictional spread and technology concentration to build a rounded picture of China Resources’s patenting behaviour. Filing volume alone does not confirm product success, market dominance or competitive strength. Readers evaluating specific opportunities, licensing targets or competitive threats should verify individual patent families directly before relying on them for business or legal decisions. The analysis that follows is meant to orient, not substitute for deeper due diligence on particular assets.
About China Resources
Company Profile: China Resources (Holdings) Co., Ltd., known as CR, is a diversified state-owned holding company registered in Hong Kong. CR was first established as “Liow & Co.” in Hong Kong in 1938, and was later restructured and renamed as China Resources Company in 1948. In 1983, it was again restructured into China Resources (Holdings) Co., Ltd. The group operates across six key business areas, including consumer products, integrated energy, urban construction and operation, healthcare, industrial finance, and technology and emerging sectors. It runs about 3,077 business entities and employs around 392,000 people. China Resources Group ranks 68th in the Fortune Global 500 for 2026. In Hong Kong, nine listed companies operate under CR, with CR Land, CR Beer and CR Mixc Lifestyle among the Hang Seng Index constituents.
Its retail, beer, power, real estate, gas and pharmaceutical businesses are industry leaders, with its Snow beer and gas operations the largest of their kind in China.
How Healthy is China Resources Patent Portfolio?
Patent portfolio health depends on how filings move through their lifecycle, and the numbers here tell a fairly balanced story. Granted patents make up 50.5% of the total, while pending applications represent 20.4%, keeping the active share at 70.8%. The composition chart in this section shows the remaining filings split across lapsed (15.2%), revoked (9.6%) and expired (4.4%) categories. This spread suggests a portfolio that is actively being prosecuted rather than one sitting dormant.
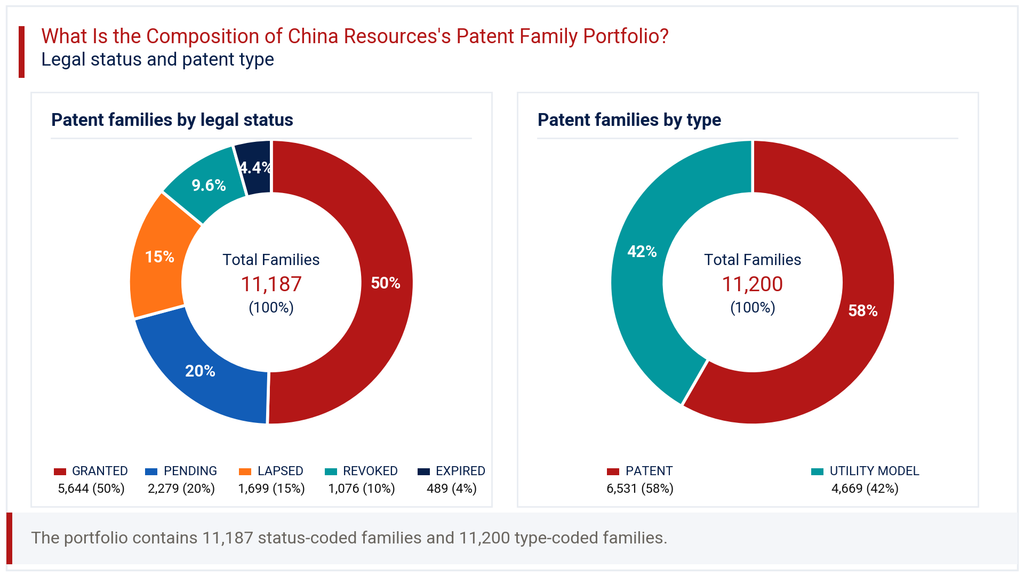
Looking at patent type, standard patents account for 58.3% of filings against 41.7% for utility models. This mix points to a company pursuing both higher-bar invention protection and faster, lower-cost utility filings, a common pattern among large Chinese conglomerates with varied product lines. The grant rate of 50.5% is a reasonable indicator of examination outcomes, though it says nothing about claim breadth or enforceability. Combined, these legal status patterns indicate a portfolio under active management, with meaningful attrition but also a steady pipeline of pending matters awaiting resolution.
How Has the China Resources Patent Portfolio Evolved Over Time?
Patent filing trends for China Resources show a long period of gradual growth followed by a sharp acceleration. Filings rose from just 35 in 2008 to 341 by 2015, then climbed steadily through the late 2010s. The filing-trend chart in this section highlights 2019 as a notable jump, with 826 families filed that year, before activity dipped slightly and then surged again.
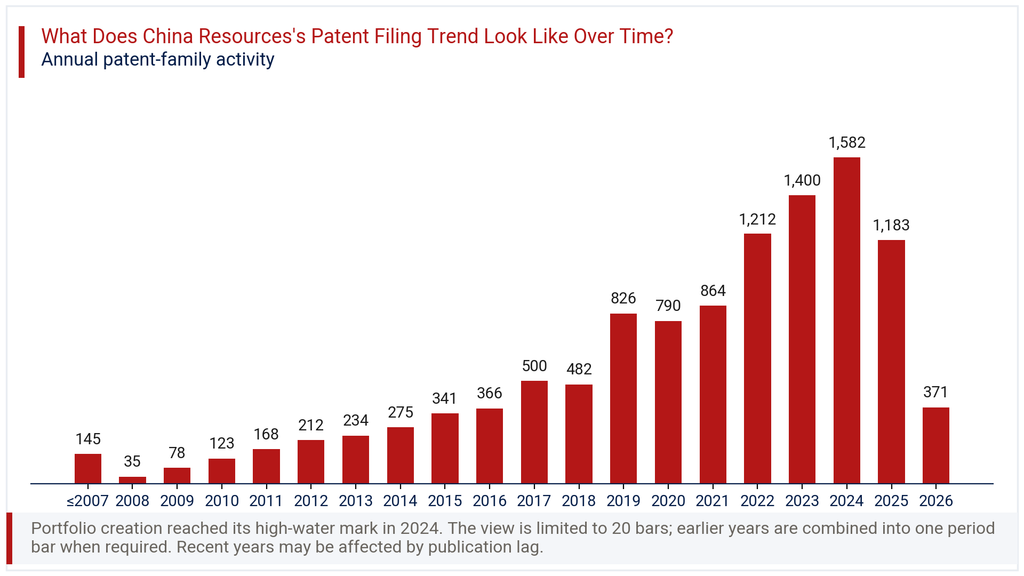
The strongest year was 2024, with 1,582 families filed, representing the peak across the entire period studied. Filings in 2025 dropped to 1,183, and 2026 shows only 371, a decline of -68.6% against the prior year. This drop should be read with caution. Patent applications typically take 18 to 24 months to publish, so recent-year counts are almost certainly understated due to publication lag rather than a genuine pullback in R&D activity. The broader decade-long trajectory, from double digits to well over a thousand annual filings, points to sustained and expanding investment in patenting across the group.
Where Does the China Resources Patent Portfolio Prioritize Patent Protection?
Patent geography for China Resources is heavily concentrated at home. China accounts for 99.2% of all filings, a figure that reflects both the scale of domestic operations and the group’s primary market focus. The geographic chart in this section shows every other jurisdiction trailing far behind, with WIPO (PCT) filings at 2.2% representing the largest channel for international protection.
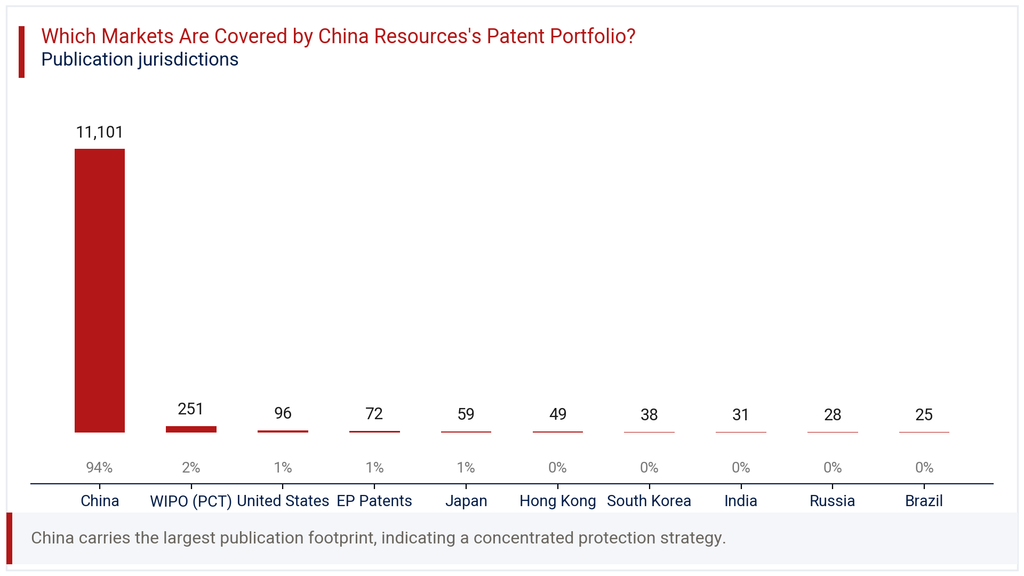
Beyond China and PCT routes, individual country filings are modest: the United States holds 0.9%, EP Patents 0.6%, Japan 0.5%, and Hong Kong 0.4%. South Korea, India, Russia and Brazil each sit at 0.3% or below. This pattern is typical of a conglomerate whose revenue base, manufacturing footprint and regulatory exposure sit predominantly within China. The limited overseas filing activity suggests international patent protection is not yet a priority, which may warrant attention if the group’s global business ambitions expand, particularly in pharmaceuticals, energy or technology segments where cross-border competition is intensifying.
Where is the China Resources Patent Portfolio Building Protection Across Key Technologies?
IPC analysis of the China Resources portfolio reveals a fairly diversified technology base rather than a single dominant focus area. The technology chart in this section shows G01N (Investigating or Analysing Materials) leading with 898 families, or 16.6% of classified filings. Close behind is G06F (Digital Data Processing) at 852 families (15.8%), signalling meaningful investment in software and data systems alongside physical sciences.
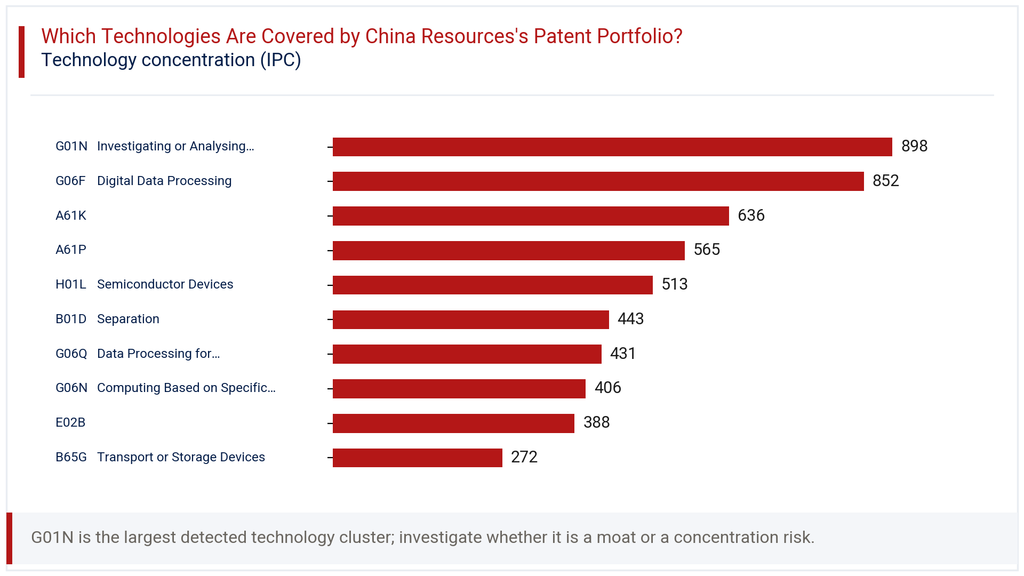
Pharmaceutical-related classes A61K and A61P together account for 11.8% and 10.5% respectively, consistent with the group’s healthcare business segment. H01L (Semiconductor Devices) follows at 9.5%, and B01D (Separation) at 8.2%, both pointing to industrial and materials processing interests. Further down, G06Q (Data Processing for Administrative/Commercial Purposes) and G06N (Computing Based on Specific Models) register 8.0% and 7.5%, showing some presence in data-driven and computational technologies. This spread across analytical instruments, digital systems, pharmaceuticals and semiconductors mirrors the conglomerate’s six-sector business structure, rather than concentrating around one core technical competency.
How Has the China Resources Patent Portfolio Evolved Across Filing Geographies?
The heatmap in this section tracks how filing activity by jurisdiction has shifted year over year, and the pattern is unambiguous. China has driven almost all volume growth, rising from 276 families in 2014 to 1,566 in 2024. Other jurisdictions show comparatively flat or declining activity across the same window.
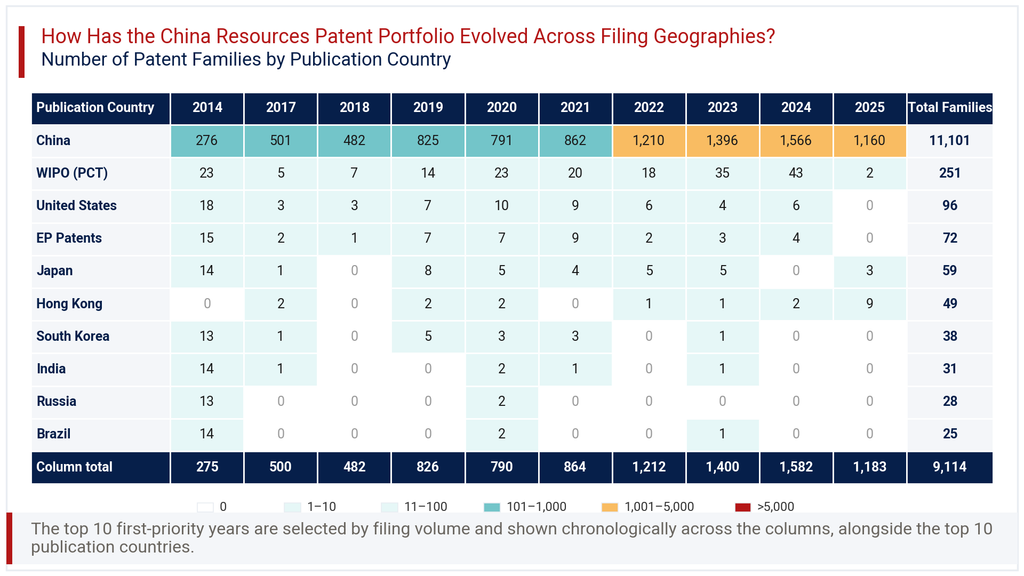
WIPO (PCT) filings moved from 23 in 2014 to a high of 43 in 2024, the closest any non-China route comes to tracking the domestic growth curve. The United States, EP Patents, Japan, South Korea, India, Russia and Brazil all show low single-digit or zero filings in most recent years, a marked contrast to their modest but present activity around 2014. This suggests international filing was never a large component of strategy, and has thinned further over the past decade. For a group of this scale, the near-total domestic concentration across years raises a fair question about how international competitors might be addressing comparable technology areas without equivalent overlap from China Resources abroad.
Consultant’s Perspective on China Resources Patent Portfolio
The China Resources Patent Portfolio reflects a pattern common among large Chinese state-owned conglomerates: substantial domestic filing volume paired with limited international presence. The 99.2% China concentration is not unusual given the group’s business model, but it does mean the portfolio offers little direct insight into how the company defends its technology abroad.
The technology spread across materials analysis, digital processing, pharmaceuticals and semiconductors tracks closely with the six declared business segments, which is a reassuring sign of filing discipline rather than scattered, opportunistic patenting. The grant rate of 50.5% and active rate of 70.8% both sit within a reasonable range for a portfolio of this size, though the revoked and lapsed share, together exceeding 24%, warrants periodic review of maintenance decisions.
Looking forward, the clearest opportunity lies in selective international filing, particularly in healthcare and semiconductor-adjacent technologies where China Resources already holds meaningful domestic depth. Competitors or partners evaluating this portfolio should treat the headline filing counts as a starting point, not a conclusion, and examine specific families relevant to their own technology interests before drawing firmer conclusions.
Explore Deeper Insights with ExpertLancing Research
This overview only scratches the surface of what the China Resources Patent Portfolio can reveal about the group’s technology priorities and competitive posture. ExpertLancing Research helps clients go further, with family-level validation, competitor benchmarking, and custom technology landscape studies tailored to specific business questions. Whether the goal is licensing due diligence, M&A screening, or tracking a competitor’s filing behaviour, our analysts can build the detailed picture your decision requires. Reach out to discuss a bespoke patent intelligence engagement.