


The CHINT Patent Portfolio offers a useful window into how one of China’s largest electrical equipment manufacturers protects its technology investments. Across 10,977 total patent families, the portfolio shows an active rate of 76.7%, covering both granted and pending filings still in force. Of these, 7,059 patents stand granted and 1,358 remain pending before patent offices. The grant rate sits at 64.3%, a reasonably strong conversion figure for a filer of this scale. Together, lapsed, expired, and revoked families total 2,560. These figures describe prosecution and maintenance outcomes only, not a judgment on patent quality or enforceability.
Filing activity peaked in 2024, when CHINT recorded 1,694 new patent families, the highest single-year count in the dataset. China dominates the jurisdictional spread, accounting for 99.7% of all filings, with the portfolio extending across 10 distinct jurisdictions in total. On the technology side, the largest cluster falls under H01H, a classification covering electric switches and related circuit control devices, totaling 4,728 families. This concentration signals where CHINT has placed its heaviest research and filing emphasis over time.
This report draws on patent filing data to describe scale, timing, geography, and technology focus within the CHINT Patent Portfolio. Filing counts alone cannot confirm commercial success, product adoption, or competitive advantage in the market. Readers evaluating specific patent families for licensing, litigation, or investment decisions should verify details directly against primary patent office records. What follows is a structured read of the numbers, intended to inform business judgment rather than substitute for it.
About CHINT
Company Profile: CHINT Group Co., Ltd. is a Chinese holding company that focuses on low-voltage electrical appliances and photovoltaic products. Chint was founded in 1984 by Nan Cunhui when he was 21 years old with five friends, who pooled 50,000 yuan in investment capital using earnings from shoe-repair work. Its electrical appliance subsidiary, Chint Electric, is listed on the Shanghai Stock Exchange. The company is headquartered in Yueqing, Zhejiang, China. According to CHINT’s official website, CHINT’s business covers 140 countries and regions, and it is a leading global provider of intelligent electrical and clean energy system solutions. The company reports its operations span three key sectors: “Green Energy”, “Intelligent Electrical Solutions”, and “Smart Home”, along with two pivotal platforms, Emerging Industries and Sci-Tech Innovation Incubation. It also operates over 20 domestic and international R&D institutions and more than 30 manufacturing bases, with a global workforce exceeding 40,000 employees.
Wikipedia lists revenue of US$22.1 billion in 2024.
How Healthy is CHINT Patent Portfolio?
Patent portfolio health depends heavily on legal status distribution, and CHINT’s numbers tell a fairly stable story. Granted patents make up 64.3% of the total, while pending applications add another 12.4%, giving the combined active rate of 76.7% referenced earlier. The composition chart in this section breaks down the remaining share: lapsed filings sit at 7.7%, expired ones at 12.5%, and revoked patents form a small 3.1% slice. This spread suggests CHINT maintains most of its filings through to grant rather than abandoning them early in prosecution.
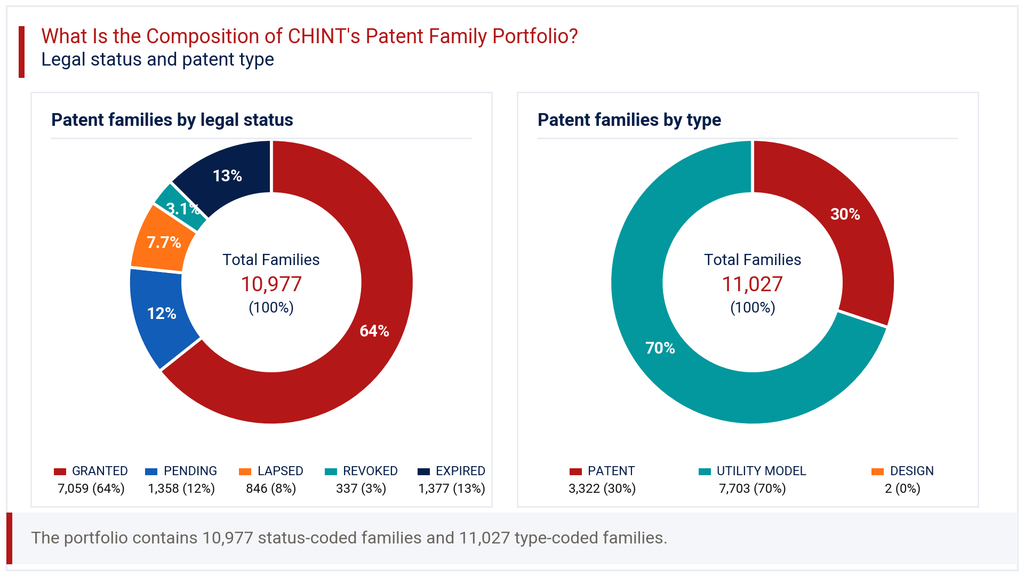
Patent type composition adds another dimension to this picture. Utility models account for 69.9% of the portfolio, far outweighing standard patents at 30.1%, with design filings barely registering at 0.0%. This heavy utility model tilt is typical for Chinese electrical equipment manufacturers, since utility models offer faster, cheaper protection for incremental engineering improvements. It points toward a filing strategy built around rapid, iterative product refinement rather than long-cycle fundamental invention. For a company serving fast-moving electrical and energy markets, this approach fits the pace of its product development cycles reasonably well.
How Has the CHINT Patent Portfolio Evolved Over Time?
Patent filing trends within the CHINT Patent Portfolio show a long period of steady growth followed by a sharp recent acceleration. Filings rose from just 52 in 2009 to 580 by 2015, then climbed further to 1,043 in 2022. The filing-trend chart in this section captures a particularly strong run between 2022 and 2024, when annual counts jumped from 1,043 to 1,378 and then to 1,694, the portfolio’s peak year.
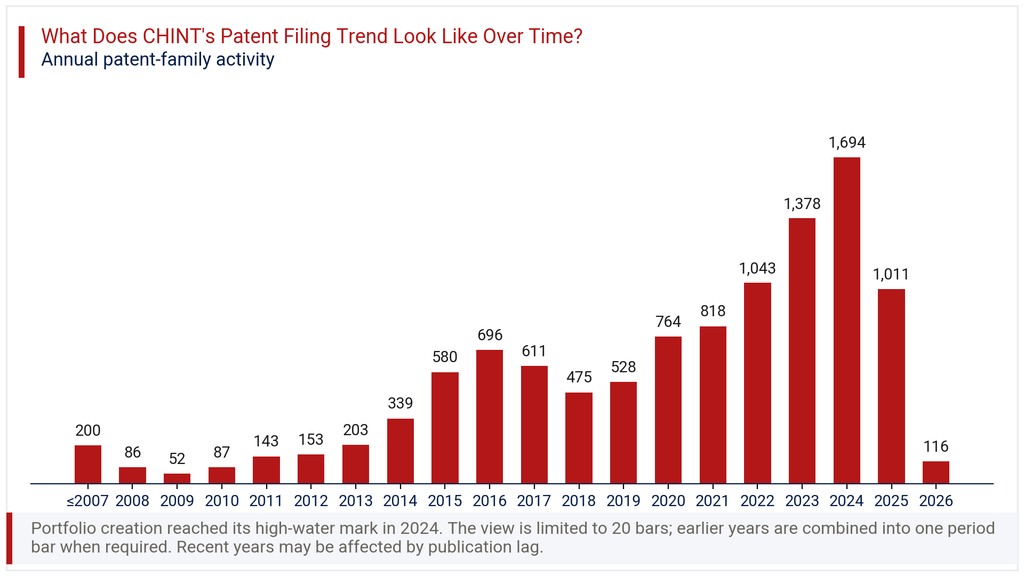
The most recent two years need careful reading, however. 2025 shows 1,011 filings and 2026 only 116, representing a -88.5% change versus the prior period. This drop almost certainly reflects publication lag rather than an actual pullback in research activity, since patent applications typically take 18 months or longer to appear in public databases. Readers should treat the last one to two years as provisional rather than conclusive. The underlying decade-long trajectory, by contrast, shows consistent and substantial growth in CHINT’s patenting activity, reflecting sustained investment in its electrical and clean energy technology base.
Where Does the CHINT Patent Portfolio Prioritize Patent Protection?
Patent geography within this portfolio is heavily concentrated in a single market. China accounts for 99.7% of all filings, a figure that dwarfs every other jurisdiction tracked. The geographic chart in this section shows WIPO PCT filings a distant second at 2.5%, followed by European Patent filings at 1.5%. The portfolio spans 10 distinct jurisdictions in total, but international filing remains a modest supplementary activity rather than a core strategy.
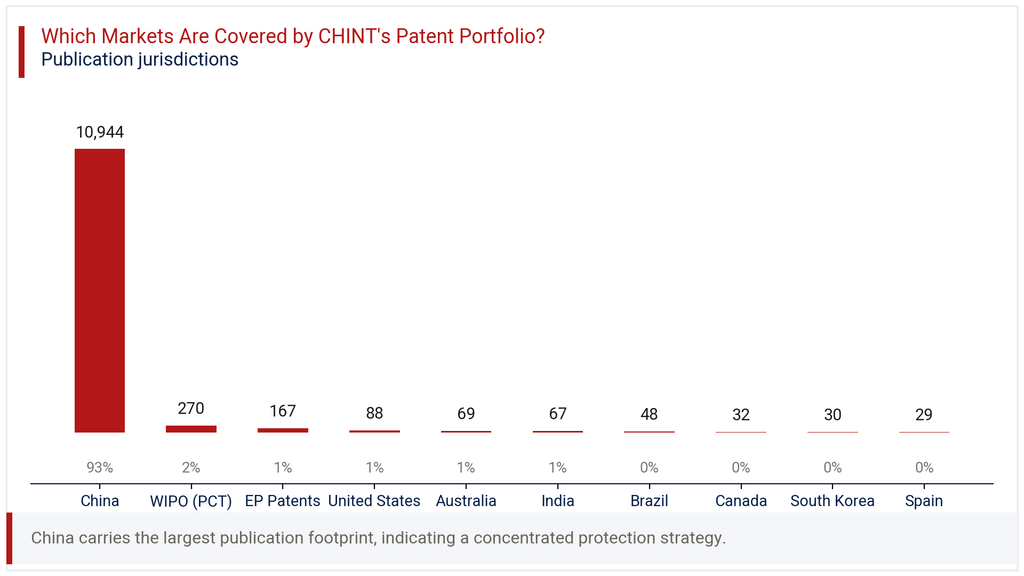
The United States, Australia, and India each hold around 0.6% to 0.8% of total filings, with Brazil, Canada, South Korea, and Spain trailing further behind at 0.3% to 0.4%. This pattern suggests CHINT treats its home market as the primary battleground for intellectual property protection, likely reflecting where its manufacturing base, supply chains, and largest customer concentration sit. The relatively light international footprint may also indicate selective filing abroad, reserved for markets with meaningful commercial activity. Companies evaluating competitive exposure outside China should note this concentration carefully, since it limits CHINT’s enforceable rights in markets beyond its domestic base.
Where is the CHINT Patent Portfolio Building Protection Across Key Technologies?
IPC analysis of the CHINT Patent Portfolio reveals a strong technological center of gravity. The H01H classification, covering electric switches and circuit control devices, leads decisively with 4,728 families, representing 52.3% of the entire portfolio. The technology chart in this section shows a steep drop after this leading cluster, with the next largest category, G01R measuring electric or magnetic variables, holding just 7.9%.
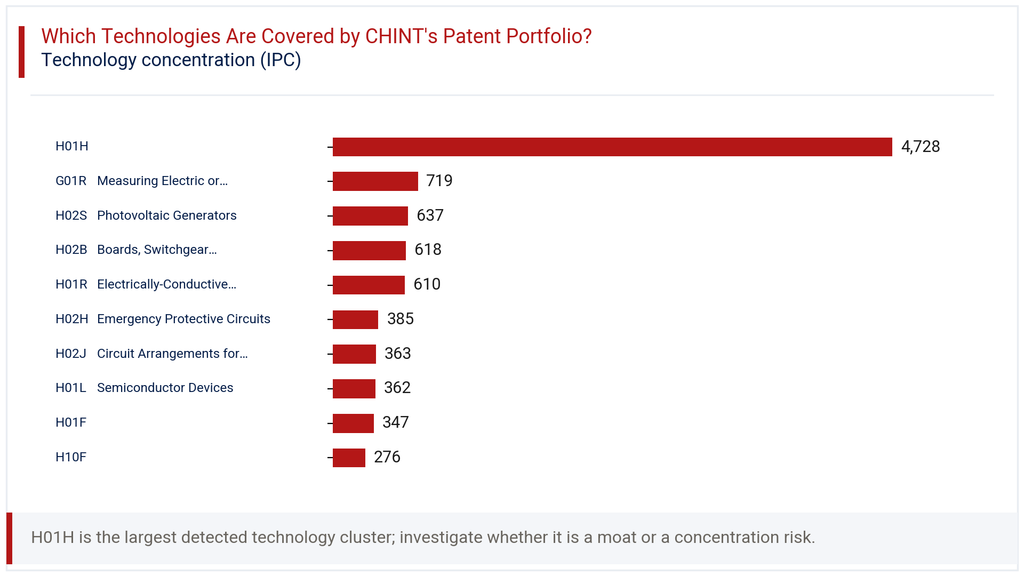
Other notable clusters include H02S, photovoltaic generators, at 7.0%, and H02B, boards and switchgear equipment, at 6.8%. H01R, electrically conductive connections, follows closely at 6.7%. This distribution confirms CHINT’s core identity as a low-voltage electrical equipment manufacturer, with switches and circuit protection forming the technological backbone. The meaningful presence of photovoltaic generator patents also signals active investment in clean energy technology, consistent with the company’s stated expansion into green energy solutions. Together, these clusters paint a picture of a company protecting both its traditional electrical business and its newer energy transition ambitions.
How Has the CHINT Patent Portfolio Evolved Across Filing Geographies?
Viewing filing activity by year and jurisdiction together adds useful texture to the broader trends already discussed. The heatmap in this section shows China’s filings climbing from 580 in 2015 to 1,689 in 2024, tracking the overall portfolio growth closely. Non-Chinese jurisdictions, by contrast, show far more volatility, with smaller absolute numbers that swing year to year rather than climbing steadily.
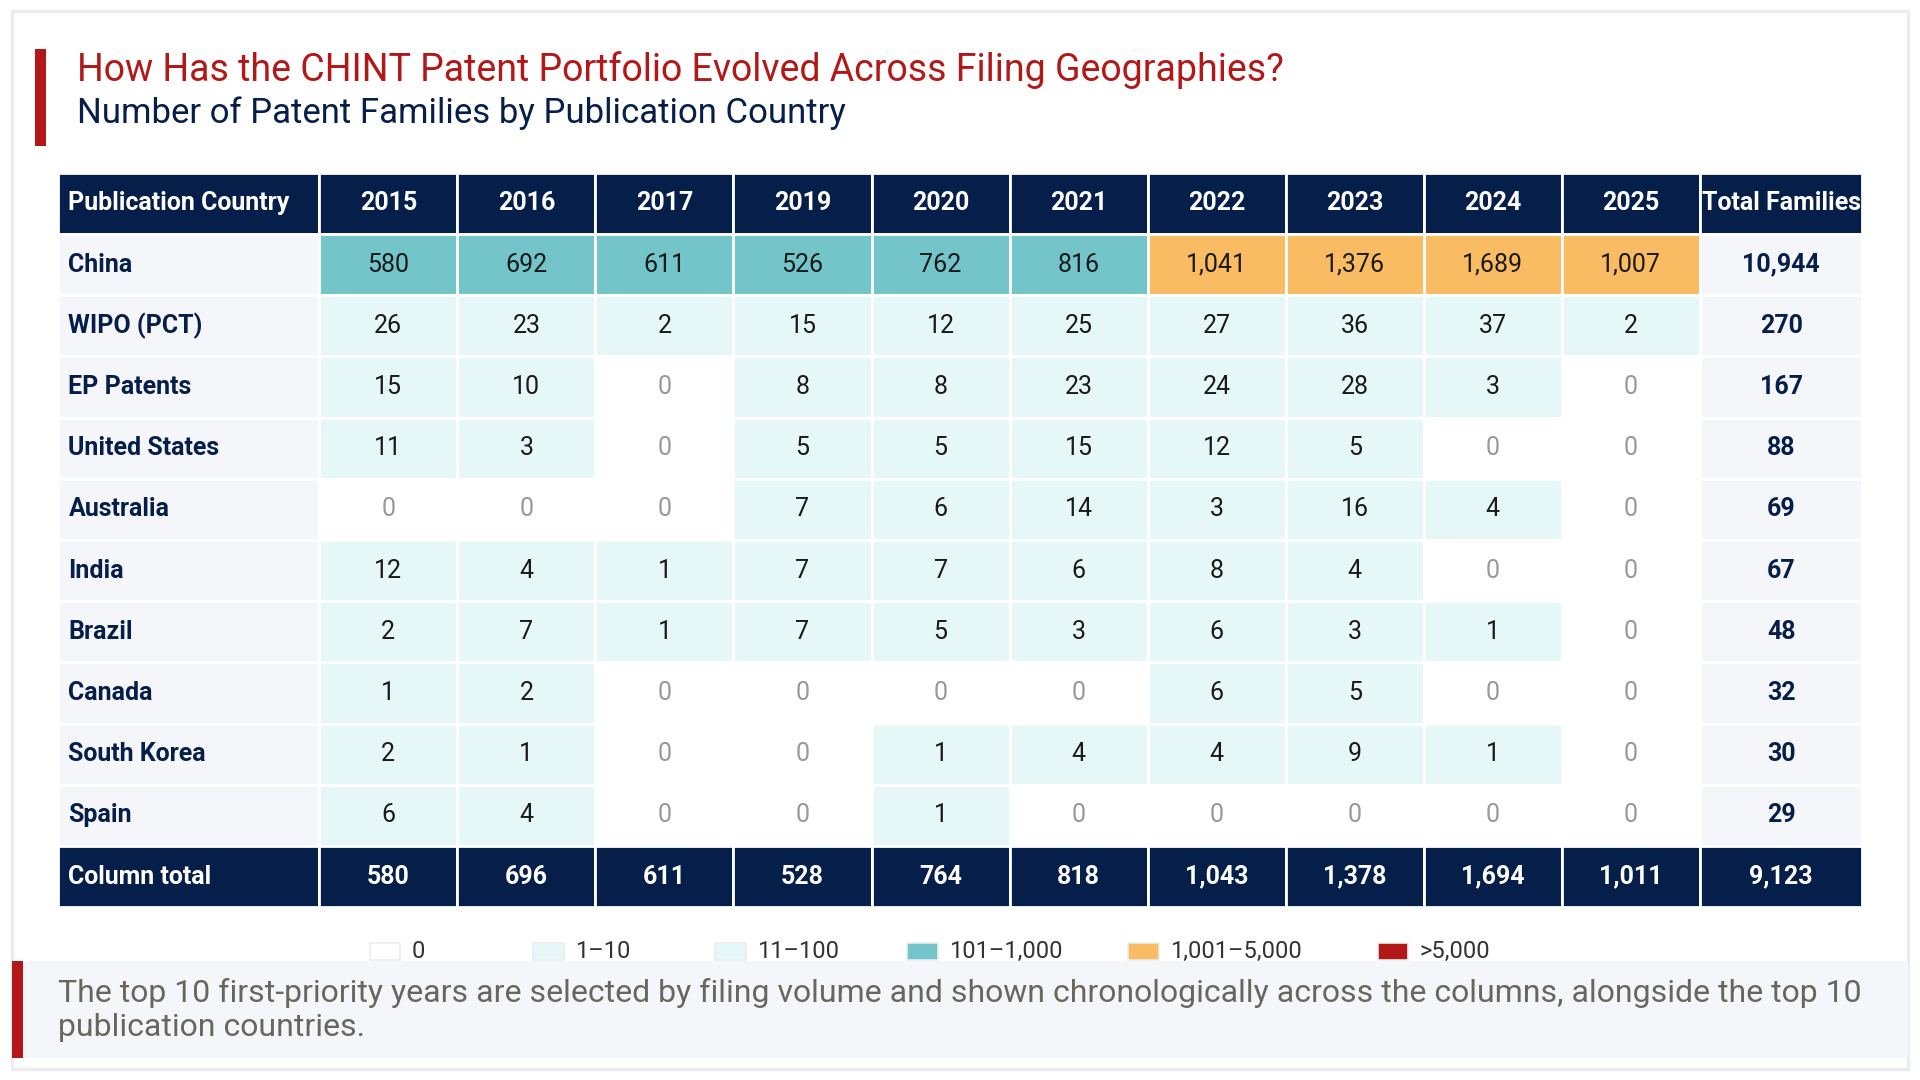
WIPO PCT filings, for instance, ranged between 2 and 37 annually, peaking in 2024 before falling sharply. European Patent filings followed a similar pattern, rising to 28 in 2023 before dropping to just 3 in 2024. The United States and India both show filings tapering toward zero by 2024 and 2025. This pattern suggests international filing decisions are made selectively, perhaps tied to specific product launches or partnership needs, rather than following a consistent annual budget. China remains the one jurisdiction with unbroken, compounding growth across the entire period studied.
Consultant’s Perspective on CHINT Patent Portfolio
From an advisory standpoint, the CHINT Patent Portfolio reflects a company firmly rooted in its domestic market while building selective technology depth. The 99.7% concentration in China is not unusual for a manufacturer of this scale, but it does raise questions about how well-protected CHINT’s innovations are in markets where it competes against global electrical equipment players. A grant rate of 64.3% and active rate of 76.7% indicate reasonably disciplined prosecution practices, without excessive abandonment.
The heavy utility model skew, at 69.9% of filings, works well domestically but offers limited leverage internationally, since many jurisdictions do not recognize utility models with comparable strength. Companies assessing CHINT as a competitor or partner should look closely at its H01H and photovoltaic generator filings, since these represent the clearest signals of where CHINT intends to defend market position. Going forward, any expansion of international filing, particularly in the H02S photovoltaic category, would signal a deliberate push to protect its clean energy ambitions beyond China. Until that shift appears clearly in the data, CHINT’s intellectual property strategy should be read primarily as a domestic defense mechanism rather than a global one.
Explore Deeper Insights with Expertlancing Research
This analysis only scratches the surface of what the CHINT Patent Portfolio can reveal about competitive positioning and technology direction. Expertlancing Research helps clients go further, with family-level patent review, claim mapping, and competitor benchmarking tailored to specific business questions. Whether you are assessing licensing opportunities, tracking a competitor’s research direction, or evaluating freedom to operate, our analysts can build the detailed picture you need. Reach out to Expertlancing Research to commission a deeper study built around your specific decision.