


The Compal Patent Portfolio offers a useful window into how one of Taiwan’s largest original design manufacturers protects its engineering output. Across 3,556 total patent families, 51.1% remain active, a figure covering both granted and pending cases. Of these, 1,511 families have been granted and 305 sit pending before patent offices. The grant rate stands at 42.5%, while lapsed, expired, and revoked families together total 1,740 (summing Lapsed, Expired, and Revoked counts). These are prosecution and maintenance indicators, not a verdict on patent quality or enforceability.
Filing activity peaked in 2020, when Compal recorded 211 new families, a marker worth noting for anyone tracking patent filing trends at the company. Taiwan dominates the jurisdictional footprint, accounting for 73.7% of filings across 10 jurisdictions tracked in this analysis. On the technology side, G06F Digital Data Processing leads the portfolio with 1,635 families, reflecting the company’s deep investment in computing hardware and data processing systems tied to its notebook and device manufacturing business.
This report draws on patent filing and legal status data to describe how Compal has built and maintained its intellectual property position. Filing volume alone does not confirm commercial success, market dominance, or technical superiority over competitors. Readers using this analysis for licensing, acquisition diligence, or competitive benchmarking should verify specific patent families independently before drawing conclusions for external use.
About Compal
Company Profile: Compal Electronics is a Taiwanese original design manufacturer founded in 1984 and headquartered in Neihu, Taipei. It handles production of notebook computers, smart phones, tablets, televisions, and wearable devices for clients worldwide, including Apple, Acer, Dell, Hewlett-Packard, Lenovo, and Sony. The company is listed on the Taiwan Stock Exchange and reported annual revenue of NT$947 billion, around US$31 billion, with over 60,000 employees globally as of December 2023. It was ranked 420th on the Fortune Global 500 list as of December 2023. The company’s official site notes its focus on notebook PCs, LCD products and smart devices built on strong R&D capability. Chairman Ray Chen has over 40 years of experience in the ICT industry, spanning notebook PCs, display panels, communication, and smart healthcare technology. Compal maintains manufacturing and service operations across Asia, the Americas and Europe, serving major global technology brands.
How Healthy is Compal Patent Portfolio?
Patent portfolio health depends on how families move through legal status categories over their lifecycle. Compal’s legal status composition chart shows 42.5% of families granted, 8.6% pending, and a combined 35.5% lapsed, 11.6% expired, and 1.8% revoked. That puts the active share, granted plus pending, at 51.1% of the total portfolio. Just over four in ten families have cleared examination and secured enforceable rights, a reasonably typical outcome for a manufacturer filing at this scale over decades.
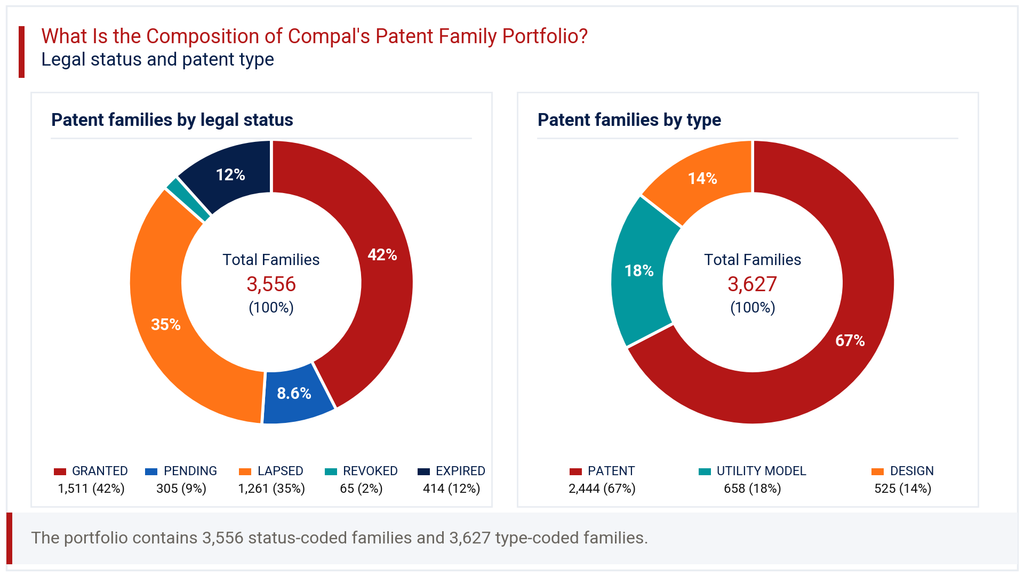
Patent type data adds further texture. Standard patents make up 67.4% of filings, utility models account for 18.1%, and design patents contribute 14.5%. This mix suggests Compal protects core engineering inventions most heavily, while still using utility models and design rights to cover incremental improvements and product aesthetics. The sizeable lapsed share likely reflects older filings reaching their natural expiry or being allowed to lapse as product lines evolved. For a company manufacturing across multiple device categories over four decades, this pattern points to active portfolio management rather than neglect, with older, less commercially relevant families pruned over time.
How Has the Compal Patent Portfolio Evolved Over Time?
The filing-trend chart tells a layered story. Early filings before 2007 total 1,257 families, reflecting a large historical base built during Compal’s growth years as a notebook ODM. Annual filings then settled into a lower band through the 2010s, ranging between 64 and 131 families most years, before climbing again from 2018 onward.
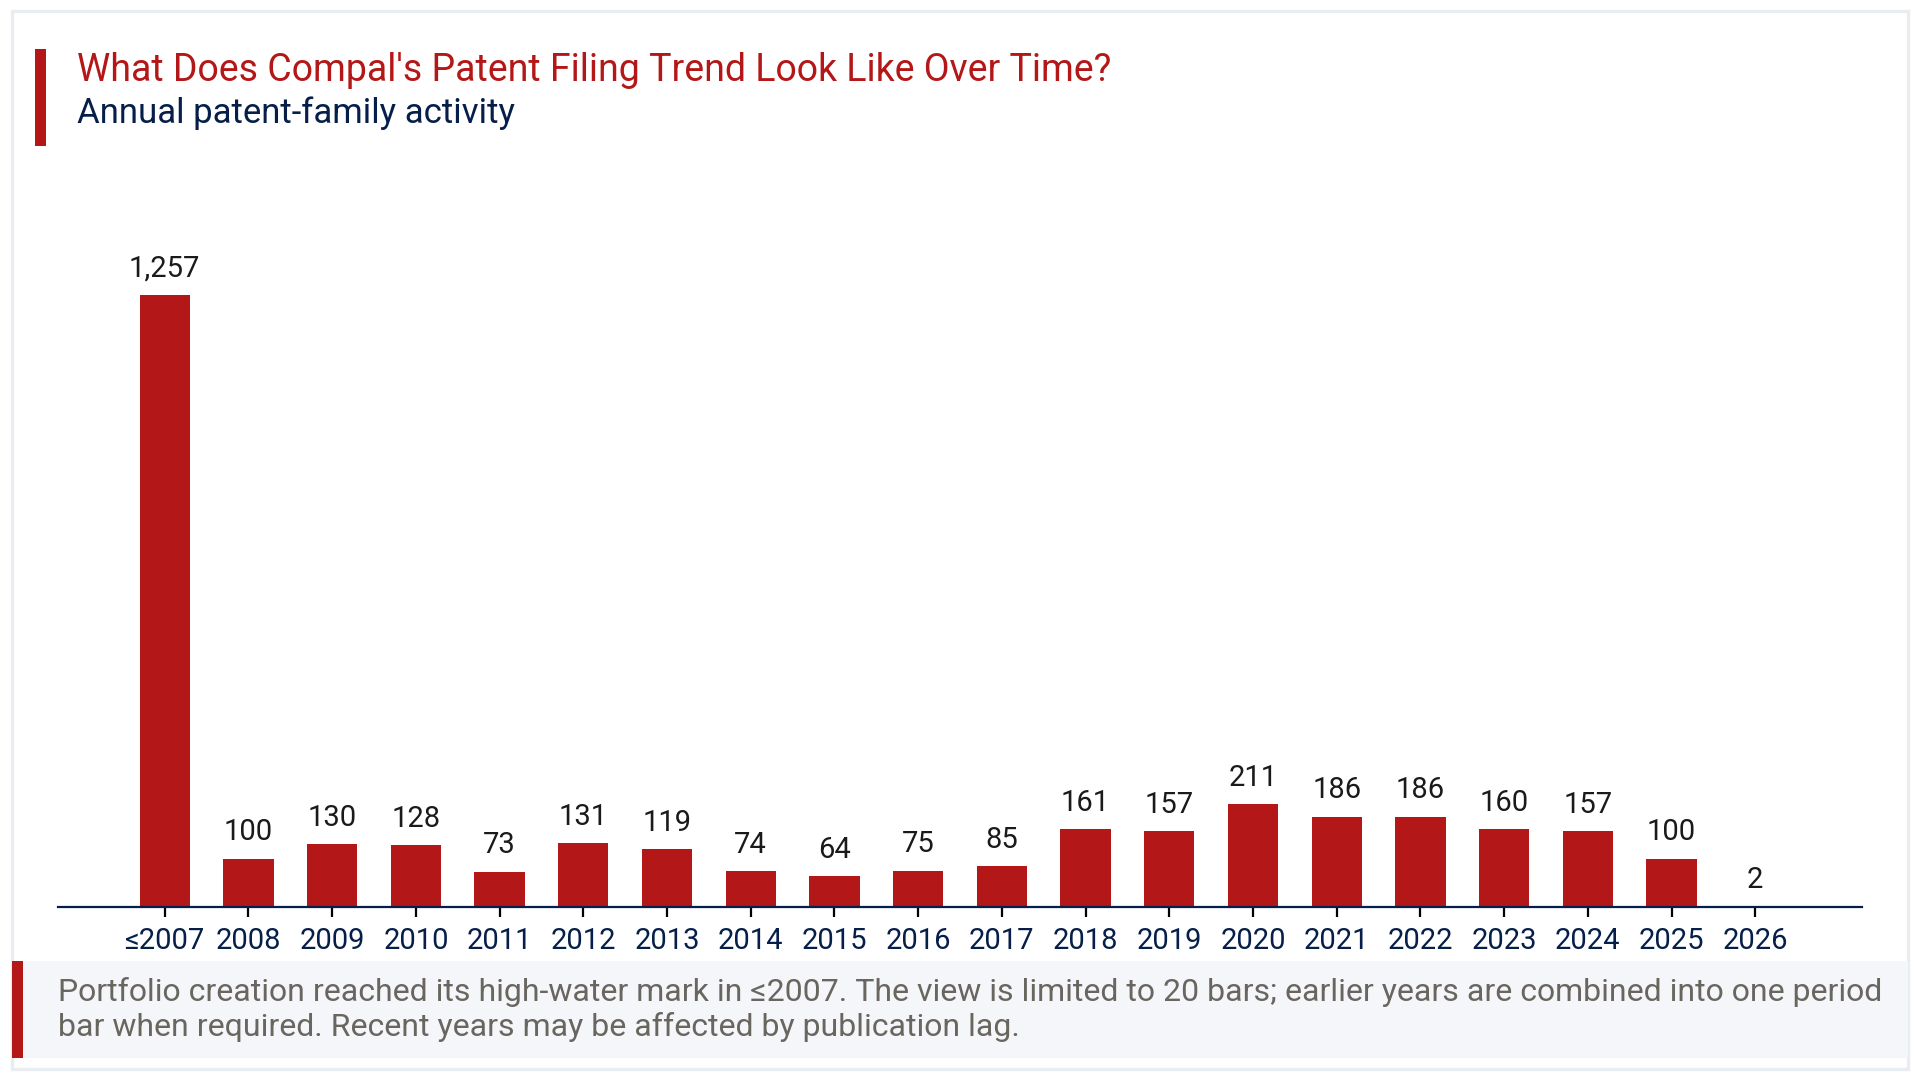
Activity peaked in 2020 at 211 families, followed by 186 in both 2021 and 2022, then a gradual step down to 160 in 2023 and 157 in 2024. The sharp apparent fall to 100 in 2025 and just 2 in 2026, a decline reflected in the latest_year_change_pct of -98.0%, should be read carefully. Patent applications typically take 18 months or longer to publish, so the most recent one to two years almost always understate true filing activity due to publication lag rather than a genuine pullback. The 2018 to 2022 window reflects a real resurgence in patent filing trends, likely tied to renewed R&D investment across computing and connected device categories.
Where Does the Compal Patent Portfolio Prioritize Patent Protection?
Patent geography for Compal is heavily concentrated at home. The geographic chart shows Taiwan leading with 2,620 families, or 73.7% of the total, consistent with its role as the company’s primary R&D and filing base. The United States follows at 1,397 families (39.3%), and China ranks third with 1,141 families (32.1%).
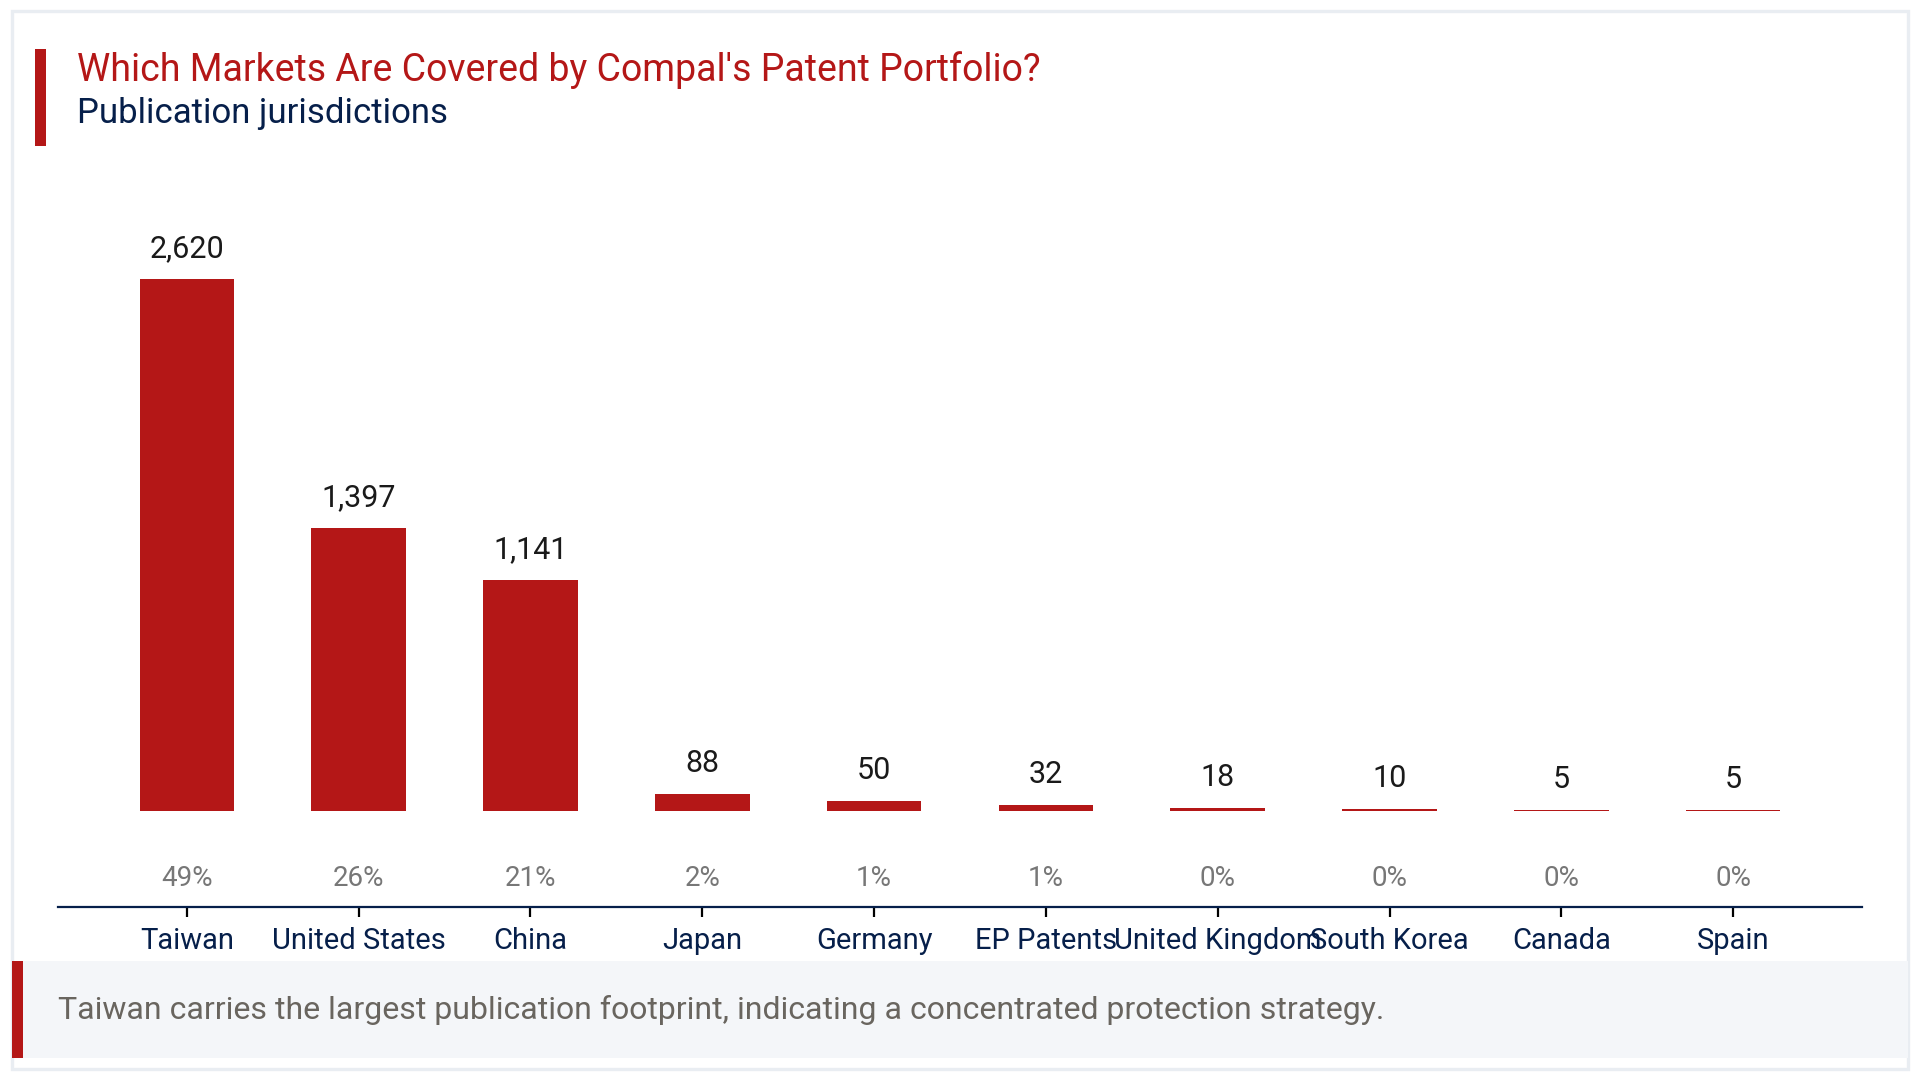
Beyond these three markets, coverage drops sharply. Japan holds 2.5% share, Germany 1.4%, EP Patents 0.9%, and the United Kingdom just 0.5%. South Korea, Canada, and Spain each register below 0.5% of total filings. This pattern indicates Compal treats Taiwan, the US, and China as its core protection markets, likely aligned with manufacturing hubs and the largest customer and competitor bases for notebook and device technology. The long tail of European and other jurisdictions suggests selective, rather than broad, international filing strategy, with protection extended internationally only for families deemed commercially significant enough to warrant the added cost.
Where is the Compal Patent Portfolio Building Protection Across Key Technologies?
The technology chart in this section highlights where Compal concentrates its engineering investment. G06F Digital Data Processing leads decisively with 1,635 families, representing 47.1% of all classified filings. This aligns closely with the company’s core notebook and computing device manufacturing business. H05K Printed Circuits and Casings ranks second with 719 families (20.7%), reflecting hardware assembly and enclosure design work central to device manufacturing.
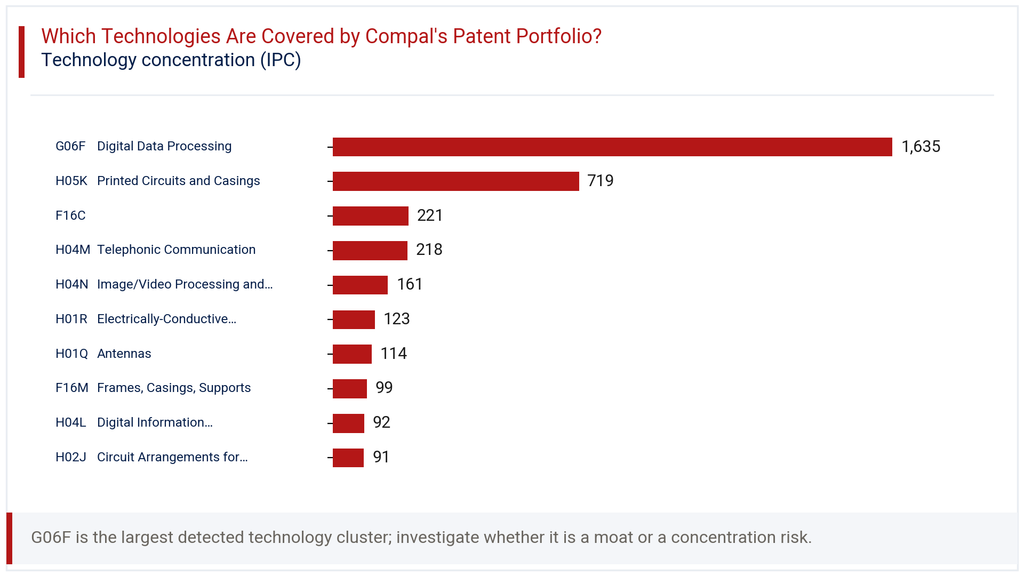
Further down the list, F16C mechanical components account for 6.4%, H04M Telephonic Communication for 6.3%, and H04N Image/Video Processing and Display for 4.6%. Smaller clusters include H01R Electrically-Conductive Connections, H01Q Antennas, F16M Frames and Casings, H04L Digital Information Transmission, and H02J Power Supply Circuits, each contributing between 2.6% and 3.5%. This IPC analysis confirms a portfolio built primarily around computing hardware, circuit design, and mechanical enclosure technology, with communication and display technologies forming a meaningful secondary layer rather than the primary focus.
How Has the Compal Patent Portfolio Evolved Across Filing Geographies?
The heatmap tracking filings by year and jurisdiction reveals how Compal’s geographic priorities shifted over two decades. In the early 2000s, Taiwan, the US, and China all received meaningful filing volumes, with Taiwan posting 96 families in 2003 and the US and China following at 29 and 81 respectively. By 2006, the US had grown to 81 families, nearly matching Taiwan’s pace that year.
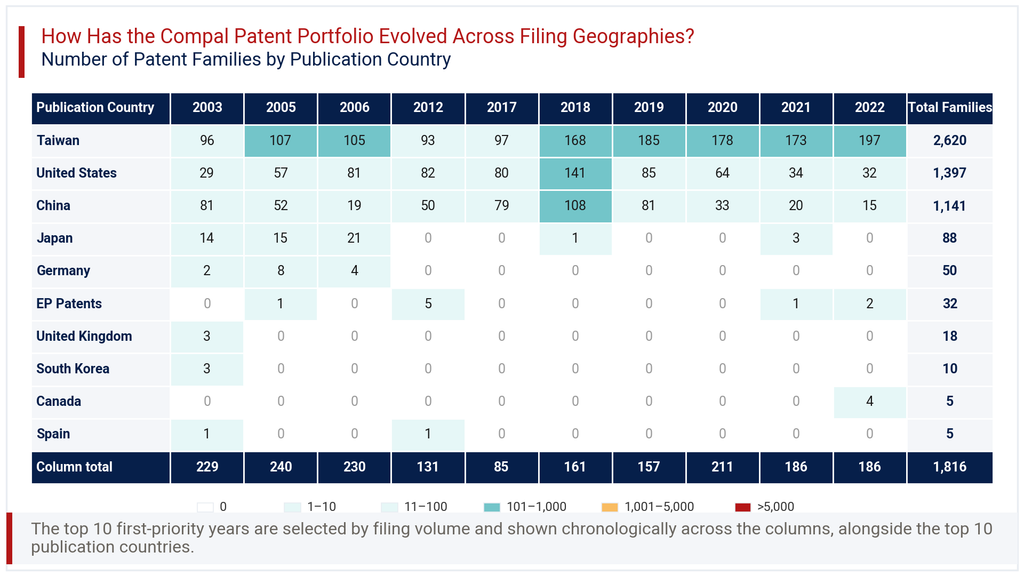
The 2018 to 2019 window stands out as a filing surge across all three core markets, with Taiwan reaching 168 and then 185 families, the US hitting 141 in 2018, and China at 108. From 2020 onward, a clear divergence appears. Taiwan filings held strong at 178, 173, and 197 across 2020 to 2022, while US filings fell from 64 to just 32, and China dropped from 33 to 15. This suggests Compal has recently recentered its filing priorities more firmly on its home jurisdiction, even as international filing activity softened.
Consultant’s Perspective on Compal Patent Portfolio
Viewed as a whole, the Compal Patent Portfolio reflects a manufacturer whose intellectual property strategy tracks its core ODM business closely. The heavy concentration in digital data processing and printed circuit technology, at 47.1% and 20.7% respectively, is exactly what one would expect from a company building notebooks, tablets, and connected devices for major global brands. The portfolio’s 51.1% active rate is reasonable for a decades-old filer, though the 35.5% lapsed share warrants periodic review to confirm it reflects deliberate pruning rather than missed maintenance deadlines.
The recent pullback in US and China filings, even accounting for publication lag, is worth watching closely. If this pattern continues once 2025 and 2026 data fully mature, it could signal a narrower international enforcement posture at a time when competitors in notebook and device manufacturing continue expanding their own US and China filings. Compal would benefit from reassessing whether its current jurisdictional mix still matches where its customers and competitors concentrate commercial activity. A periodic refresh of filing strategy, tied to product roadmap and customer geography, would help ensure the portfolio keeps pace with where real commercial risk and opportunity sit.
Explore Deeper Insights with Expertlancing Research
This overview of the Compal Patent Portfolio only scratches the surface of what deeper patent analytics can reveal. Expertlancing Research helps technology companies, investors, and legal teams go further, mapping competitor filing strategies, identifying licensing opportunities, and assessing freedom-to-operate risk with precision. If you are evaluating Compal, a competitor, or a potential acquisition target, our research team can build a custom analysis tailored to your specific business question. Reach out to Expertlancing Research to start that conversation today.