


The FiberHome Patent Portfolio offers a useful window into how a major Chinese telecommunications equipment maker protects its technology investments. Across 6,516 total patent families, the portfolio shows an active rate of 69.2% when granted and pending cases are combined. Of these, 3,593 families have been granted and 917 remain pending before patent offices. The grant rate stands at 55.1%, a figure that reflects examiner outcomes rather than innovation quality. Meanwhile, 2,006 families fall into lapsed, revoked, or expired status combined. These are prosecution and maintenance metrics only, not a verdict on legal strength or market relevance.
Filing activity peaked in 2019, when FiberHome filed 616 patent families in a single year. China dominates the jurisdictional footprint, accounting for 99.8% of filings under jurisdictions_pct, out of 10 jurisdictions tracked in this analysis. The leading technology cluster is H04L, Digital Information Transmission, with 2,419 families, representing the single largest concentration of inventive activity across the company’s filing history. This cluster alone signals where FiberHome has placed its heaviest research and development bets.
This article uses patent filing data to build a picture of where FiberHome has concentrated its research effort and legal protection over time. Filing counts alone do not establish commercial success, product adoption, or competitive superiority in the market. Readers considering this analysis for investment, partnership, or competitive benchmarking should treat it as a starting point. Specific patent families referenced here would need independent verification before being used in any formal business or legal decision.
About FiberHome
Company Profile: FiberHome Telecommunication Technologies Co., Ltd. is a networking and telecommunication equipment provider based in China. Wuhan FiberHome International Technologies Co., Ltd. is an enterprise under China Information Technology Group and an internationally renowned provider of information and communication network products and solutions. It is recognised by the Ministry of Science and Technology as an industrialization base for optical communication under China’s “863” plan.
The company’s mission centres on maximizing the value of digital connection and benefiting human society. Its core offerings span fixed networks, wireless networks, optical fibre and cable, marine networks, and digital power solutions. FiberHome has built a sales and service system in more than 50 countries, operates 11 global delivery centres, and its products reach over 90 countries and regions, with industrial bases across China, South America, South Asia, and North Africa. In May 2020, the U.S.
Commerce Department’s Bureau of Industry and Security added FiberHome to its Entity List governing export regulations.
How Healthy is FiberHome Patent Portfolio?
Patent portfolio health depends heavily on legal status distribution, and FiberHome’s numbers tell a layered story. Granted patents make up 55.1% of the portfolio, per legal_status_pct, while pending applications add another 14.1%. Together these give an active rate of 69.2%, meaning roughly seven in ten families remain legally alive or under review. On the other side, lapsed cases account for 13.6%, revoked cases another 13.6%, and expired families sit at 3.6%. The composition chart in this section shows these proportions clearly, with lapsed and revoked status nearly matching each other in scale.
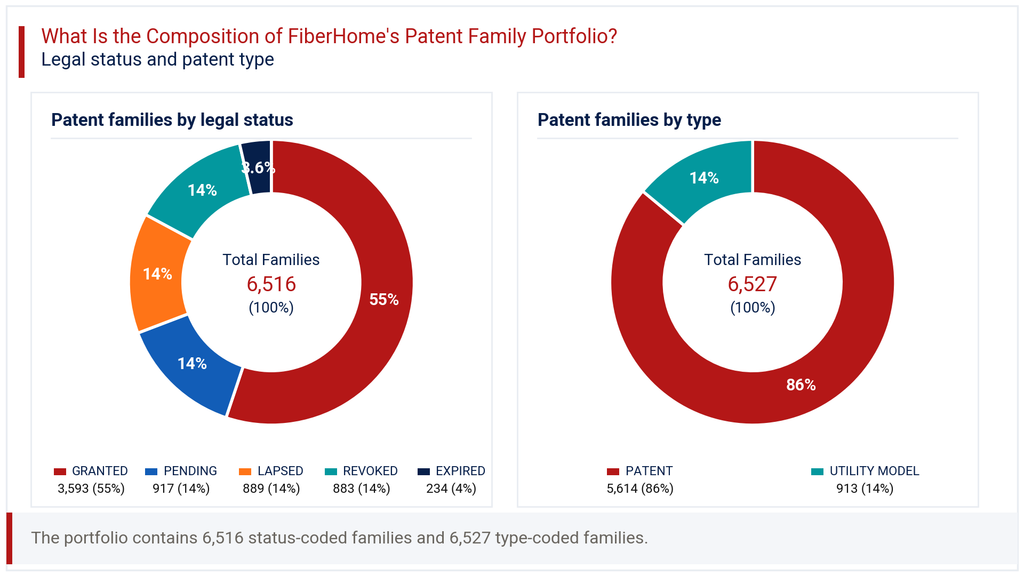
Patent type composition adds further texture. Standard patents represent 86.0% of filings, while utility models account for 14.0%, per patent_type_pct. This split suggests FiberHome relies primarily on full patent protection rather than the faster, shorter-term utility model route common in China. The meaningful share of revoked and lapsed cases does warrant attention. It may reflect deliberate portfolio pruning, cost management, or genuine examination challenges. Either way, a sizeable minority of filings have not survived their full legal lifecycle, which any counterparty should weigh when assessing portfolio depth.
How Has the FiberHome Patent Portfolio Evolved Over Time?
Patent filing trends at FiberHome show a long climb followed by a recent pullback. From 68 families filed in 2008, volumes rose steadily through the next decade, crossing 300 families by 2015 and reaching 616 in 2019, the historic peak. The filing-trend chart in this section traces this upward arc clearly, with 2018 and 2019 marking the steepest growth phase. This period likely coincides with FiberHome scaling its research output alongside broader expansion into fixed network, wireless, and optical fibre technologies.
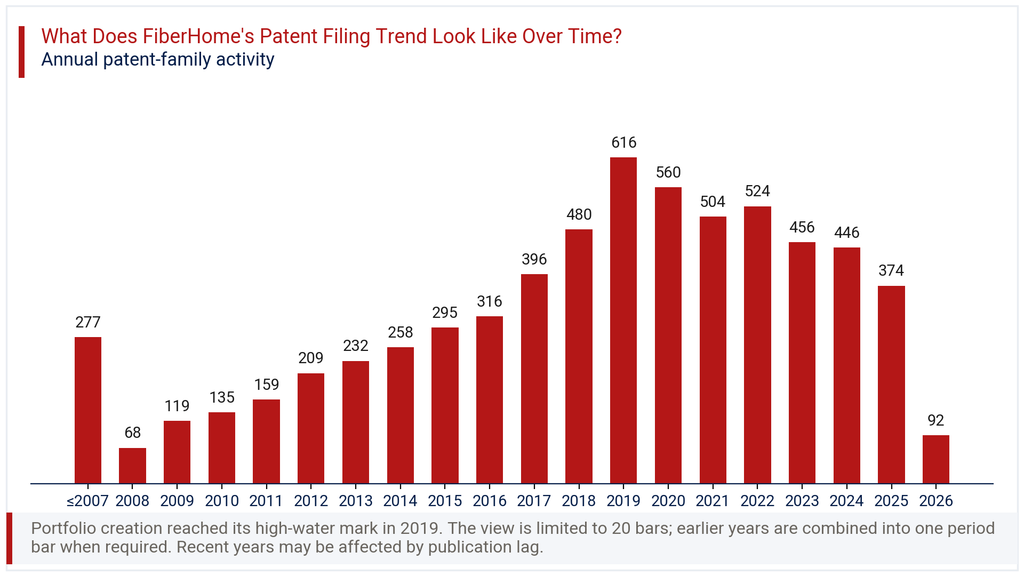
Since 2019, annual filings have gradually eased, falling to 446 in 2024 and 374 in 2025. The 2026 figure of 92 families shows a sharp year-on-year change of -75.4%, per latest_year_change_pct. This drop should not be read as a genuine collapse in research activity. Patent applications typically take many months, sometimes years, to appear in public databases after filing. The most recent one to two years in any portfolio almost always understate real filing volume because of this publication lag. The broader decade-long trend still points to a mature, consistently active filing programme.
Where Does the FiberHome Patent Portfolio Prioritize Patent Protection?
Patent geography at FiberHome is overwhelmingly domestic. China accounts for 99.8% of filings under jurisdictions_pct, by far the largest share of any jurisdiction tracked. The geographic chart in this section shows China towering over every other location, with 6,503 families filed there out of the total portfolio. This pattern is typical for Chinese telecommunications manufacturers whose primary research, manufacturing, and initial customer base remain concentrated at home.
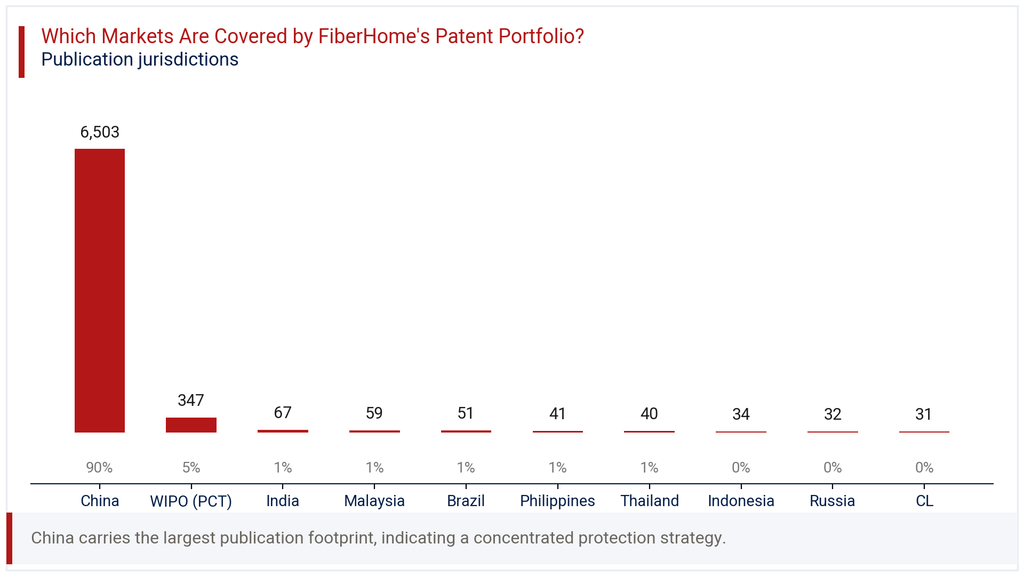
International filing activity, while numerically smaller, still signals where FiberHome sees export opportunity. WIPO’s PCT route carries 5.3% share with 347 families, serving as the main gateway toward international protection. India, Malaysia, Brazil, the Philippines, Thailand, Indonesia, Russia, and Chile each contribute smaller shares, ranging from 1.0% down to 0.5%. These markets align closely with regions where FiberHome has stated industrial bases or sales presence, including South America, South Asia, and North Africa. The comparatively thin international footprint suggests patent protection abroad plays a supporting role rather than a primary strategic focus for the company.
Where is the FiberHome Patent Portfolio Building Protection Across Key Technologies?
IPC analysis of the FiberHome Patent Portfolio reveals a clear concentration in communication and data processing technologies. H04L, Digital Information Transmission, leads with 2,419 families and a 34.1% share, per ipc_pct. G06F, Digital Data Processing, follows at 18.3% with 1,296 families. The technology chart in this section shows these two classes together accounting for over half of all technology-tagged filings, underlining FiberHome’s core identity as a network equipment and data transmission company.
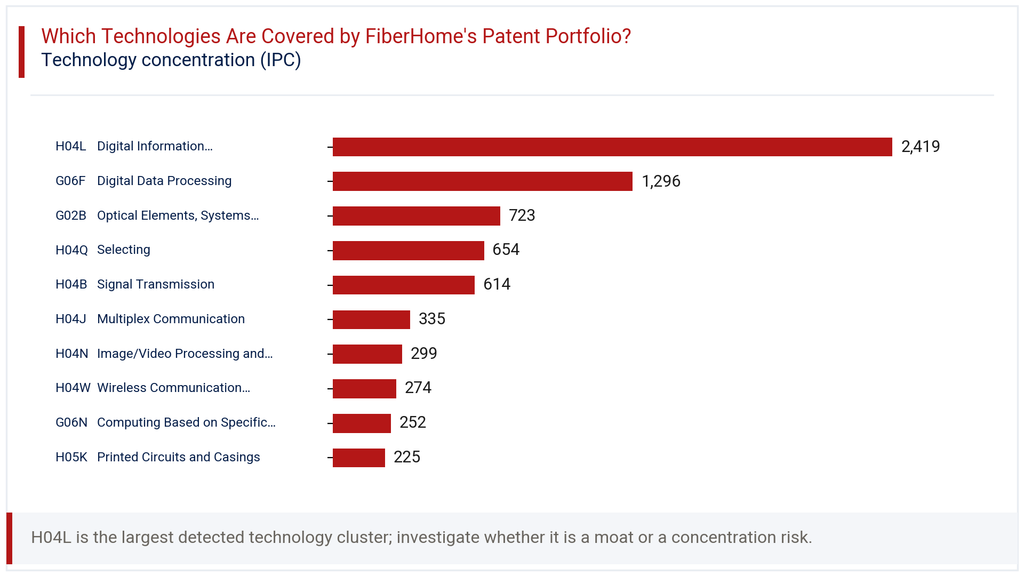
Behind these leaders, G02B Optical Elements and Systems holds 10.2% share with 723 families, directly reflecting FiberHome’s optical fibre and cable business line. H04Q Selecting and H04B Signal Transmission contribute 9.2% and 8.7% respectively, reinforcing the network infrastructure focus. Smaller but notable clusters include H04W Wireless Communication Networks at 3.9% and G06N computing based on specific models at 3.6%. This spread shows a portfolio built around core telecom transmission technology, supported by complementary strength in optics, wireless, and emerging computational methods.
How Has the FiberHome Patent Portfolio Evolved Across Filing Geographies?
Viewing filing activity by year and jurisdiction together sharpens the picture of FiberHome’s international ambitions over time. The heatmap in this section shows China maintaining consistently high volumes every year from 2016 through 2025, peaking at 616 families in 2019. International jurisdictions, by contrast, show much more volatile and generally declining patterns across the same period.
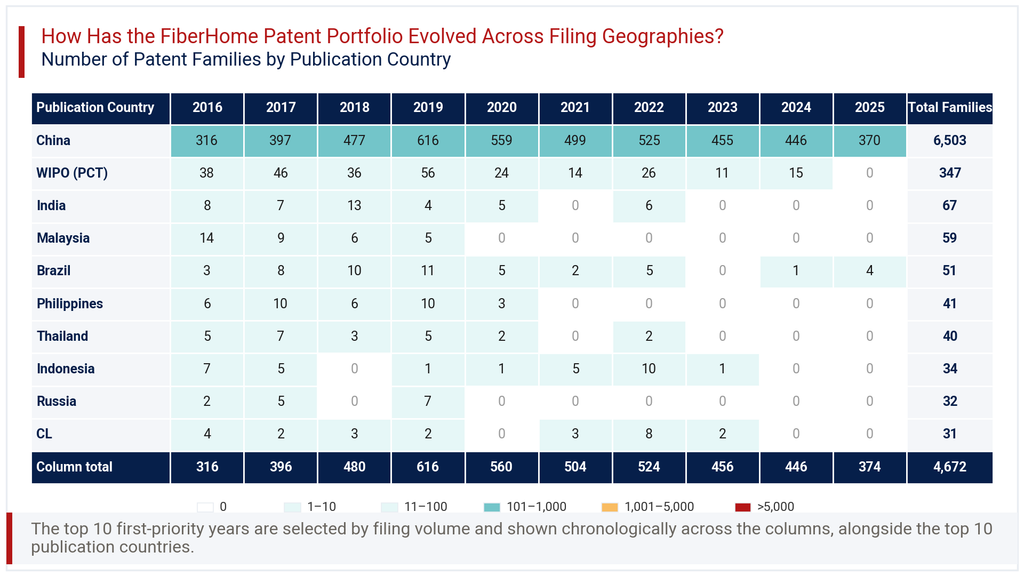
WIPO PCT filings rose to 56 in 2019 alongside the domestic peak, then fell sharply to single digits by 2023 and 2024. India, Malaysia, Thailand, and Russia all show filings tapering to zero in recent years, with India’s last recorded activity in 2022 at just 6 families. Brazil remains one of the more persistent international markets, still logging 4 families in 2025. This pattern suggests FiberHome scaled back several international filing programmes after 2019, possibly reflecting cost discipline, shifting market priorities, or trade restrictions affecting certain export markets during this period.
Consultant’s Perspective on FiberHome Patent Portfolio
Taken as a whole, the FiberHome Patent Portfolio reflects a company whose innovation engine runs primarily through its domestic China operations. The 69.2% active rate signals a reasonably well-maintained portfolio, though the combined 27.2% share of lapsed and revoked families deserves closer scrutiny by anyone evaluating licensing or acquisition opportunities. The heavy concentration in H04L and G06F technologies confirms FiberHome’s core competence in transmission and data processing infrastructure.
What stands out most is the contraction in international filing since 2019. Markets like India, Malaysia, and Thailand have gone quiet in recent years, even as China filings continued at scale through 2024. This could reflect deliberate cost rationalisation, regulatory headwinds following the 2020 Entity List designation, or a strategic pivot toward domestic market defence. For competitors and partners, this narrowing international footprint may open whitespace in certain export markets. FiberHome’s technology strength remains undisputed at home, but its patent protection abroad now looks considerably thinner than it did five years ago. Organizations assessing competitive exposure should watch whether international filing resumes or continues to shrink.
Explore Deeper Insights with Expertlancing Research
This overview of the FiberHome Patent Portfolio only scratches the surface of what structured patent intelligence can reveal. Expertlancing Research helps organizations go further, mapping specific patent families, assessing claim strength, and benchmarking against competitors in the same technology space. Whether you are evaluating a partnership, tracking a competitor, or scouting for licensing opportunities, our analysts can build a tailored patent intelligence report. Reach out to Expertlancing Research to turn these patterns into decisions you can act on with confidence.