


The Foxconn Patent Portfolio offers a useful window into how one of the world’s largest electronics manufacturers protects its engineering output. Across a total of 12,352 patent families, the active rate stands at 38.4%, a figure that covers both granted and pending cases. Of these, 2,722 families have been granted and 2,015 remain pending, giving a grant rate of 22.0%. Meanwhile, 7,615 families sit in lapsed, expired, or revoked status combined. These are prosecution and maintenance metrics, not a verdict on patent quality or enforceability.
Filing activity peaked in the pre-2008 window, with 3,351 families recorded in the “≤2007” bucket, the single largest count in the dataset. China leads as the top jurisdiction, holding 55.3% of jurisdictional share, and the portfolio spans 10 jurisdictions in total. On the technology side, H05K Printed Circuits and Casings dominates as the leading cluster, accounting for 3,487 families.
This article draws on patent filing and legal status records to map how Foxconn has built and maintained its intellectual property position. Filing counts alone do not establish market success or competitive advantage in any product category. Readers evaluating specific families for licensing, diligence, or litigation purposes should independently verify status and claims before relying on this analysis externally.
About Foxconn
Company Profile; Hon Hai Precision Industry Co., Ltd., trading internationally as Foxconn, is a Taiwanese multinational electronics contract manufacturer. It was established in 1974 with headquarters in Tucheng District, New Taipei City, Taiwan. It is the world’s largest contract manufacturer of electronics, and while headquartered in Taiwan, the company earns the majority of its revenue from assets in China. In 2023, the company’s annual revenue reached 6.16 trillion New Taiwan dollars, equivalent to US$198.533 billion in 2024, ranking it 20th on the Fortune Global 500.
Foxconn manufactures electronic products for major American, Canadian, Chinese, Finnish, and Japanese companies. The company reports it has expanded into electric vehicles, digital health and robotics. It is also building capabilities in AI, semiconductors and new-generation communications technology, which support four core product pillars covering smart consumer electronics, cloud and networking, computing products and components.
The company reports operating R&D and manufacturing centers across more than 20 countries, including China, India, Japan and the United States.
How Healthy is Foxconn Patent Portfolio?
Patent portfolio health is best read through legal status composition. Of the 12,352 families tracked, 22.0% have been granted and 16.3% remain pending examination. The largest share, 46.7%, falls under lapsed status, while 10.6% have expired and 4.3% were revoked. This status mix, visible in the composition chart, points to a portfolio where a meaningful share of older filings were allowed to lapse rather than maintained through full term.
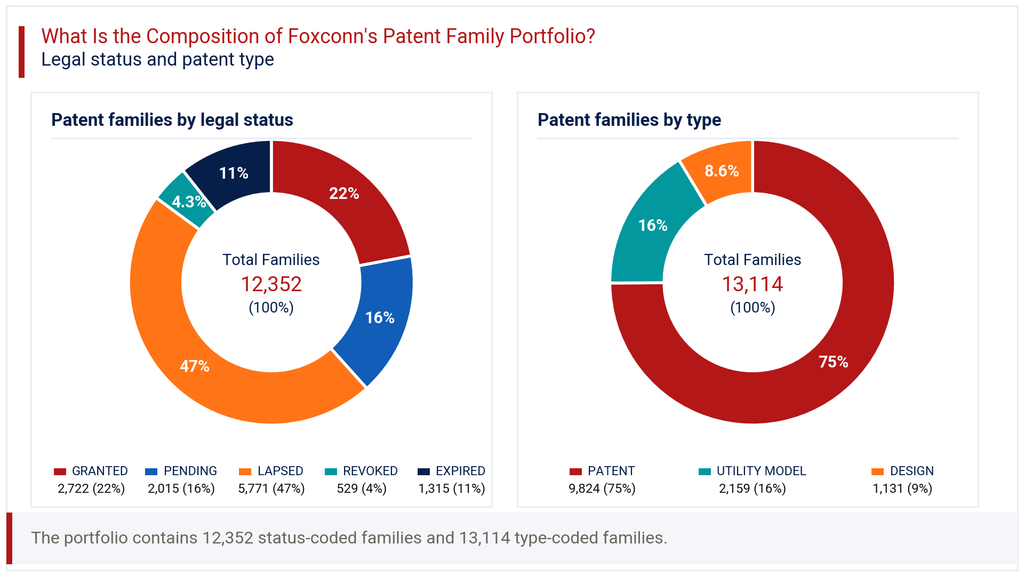
Patent type data adds further texture. Standard patents account for 74.9% of filings, utility models for 16.5%, and design rights for 8.6%. This mix suggests Foxconn protects core engineering concepts primarily through full patents, while using utility models and designs for incremental or cosmetic innovations. The relatively high lapsed share is not unusual for a manufacturer with decades of filing history and thousands of legacy families. It does, however, suggest that active enforcement and maintenance budgets are concentrated on a smaller, more current subset. Businesses assessing this portfolio for licensing or competitive benchmarking should focus on the granted and pending slices rather than the historical total.
How Has the Foxconn Patent Portfolio Evolved Over Time?
Patent filing trends, as shown in the filing-trend chart, reveal a portfolio shaped heavily by early-stage expansion. The “≤2007” bucket alone contributed 3,351 families, followed by steady volumes of 1,777 in 2008 and 1,365 in 2009. Filing counts then declined through the following decade, settling into a narrower band of roughly 200 to 300 families per year from 2016 onward.
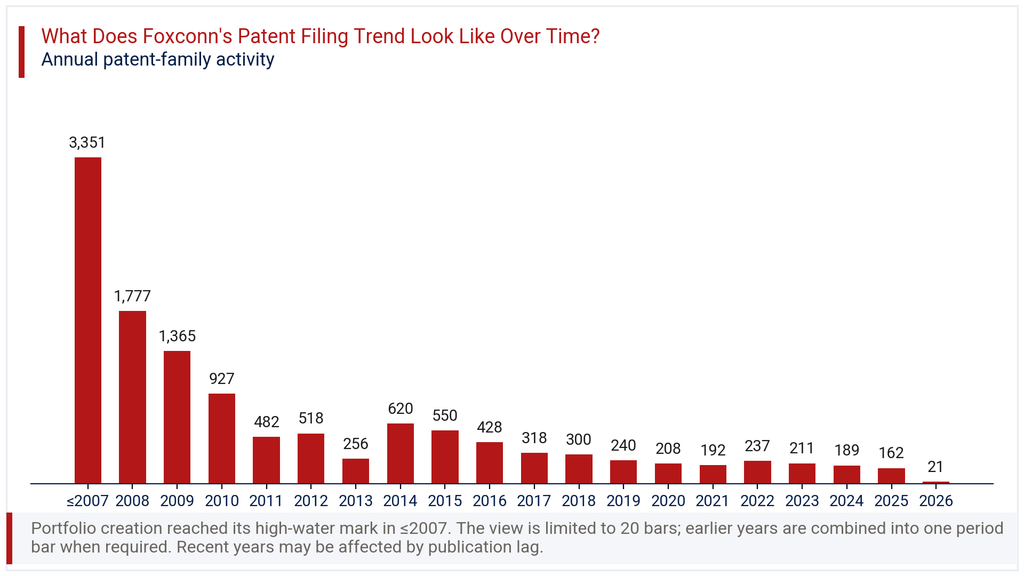
Recent years show counts of 237 in 2022, 211 in 2023, 189 in 2024, and 162 in 2025, with the 2026 figure of 21 reflecting a partial year. The data also shows a -87.0% change in the latest year, a figure that should be read alongside publication lag rather than as a genuine collapse in filing activity. Patent applications typically take many months to appear in public databases, so the most recent one to two years understate real filing volume. The broader pattern still points to a maturing portfolio, with Foxconn filing fewer but likely more selective and concentrated applications compared with its earlier high-volume years.
Where Does the Foxconn Patent Portfolio Prioritize Patent Protection?
Patent geography for Foxconn centers heavily on three markets. China holds the largest share at 55.3%, followed closely by Taiwan at 48.5% and the United States at 47.2%. Together these three jurisdictions account for the overwhelming majority of filing activity, as the geographic chart in this section makes clear. Japan trails well behind at 3.5%, while South Korea and EP Patents each hold 0.6%.
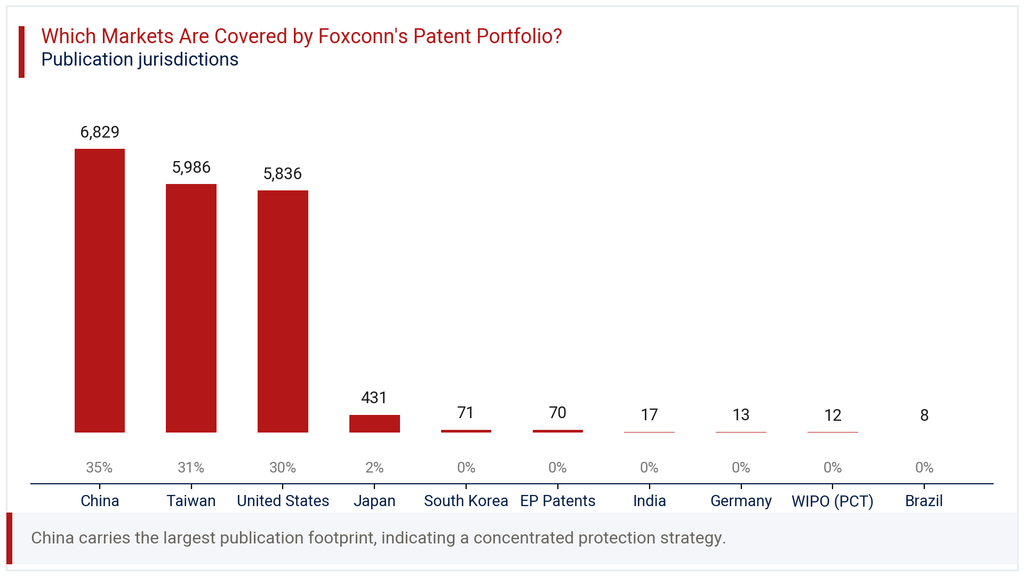
The remaining jurisdictions, including India, Germany, WIPO (PCT), and Brazil, each account for 0.1% of the portfolio. This concentration pattern makes sense given Foxconn’s manufacturing footprint and customer base, with Taiwan as home jurisdiction, China as the primary production base, and the United States as a key commercial and legal market. The thin presence across India, Europe, and Latin America suggests limited emphasis on patent protection in those regions historically. Companies evaluating competitive exposure outside the core three markets should note this gap when assessing freedom-to-operate risk.
Where is the Foxconn Patent Portfolio Building Protection Across Key Technologies?
IPC analysis of the Foxconn Patent Portfolio shows clear concentration in hardware and electromechanical categories. H05K Printed Circuits and Casings leads with 3,487 families, representing 27.4% of classified filings. H01R Electrically-Conductive Connections follows with 2,770 families, or 21.8%, and G06F Digital Data Processing ranks third with 2,035 families at 16.0%.
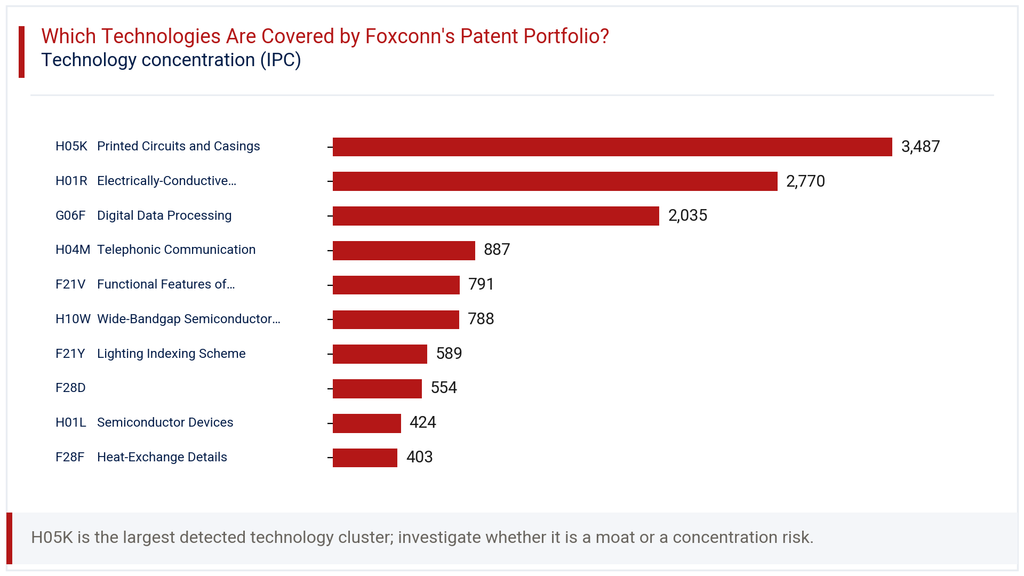
Beyond these top three, H04M Telephonic Communication holds 7.0%, while F21V Functional Features of Lighting Devices and H10W Wide-Bandgap Semiconductor Devices each account for 6.2%. The technology chart in this section also shows meaningful activity in F21Y Lighting Indexing Scheme at 4.6% and F28D heat-exchange related classes at 4.4%. This spread reflects Foxconn’s core identity as an electronics assembler, with heavy investment in circuit packaging, connectors, and thermal management rather than software or algorithmic categories. The presence of semiconductor and wide-bandgap device classes, though smaller, hints at gradual movement toward higher-value component technologies.
How Has the Foxconn Patent Portfolio Evolved Across Filing Geographies?
The heatmap tracking filings by year and jurisdiction shows China, Taiwan, and the United States moving in close parallel through the mid-2000s. In 2008, all three jurisdictions hit their respective peaks, with China at 821, Taiwan at 787, and the United States at 883 families. This synchronized surge suggests a coordinated global filing strategy around that period rather than market-specific pushes.
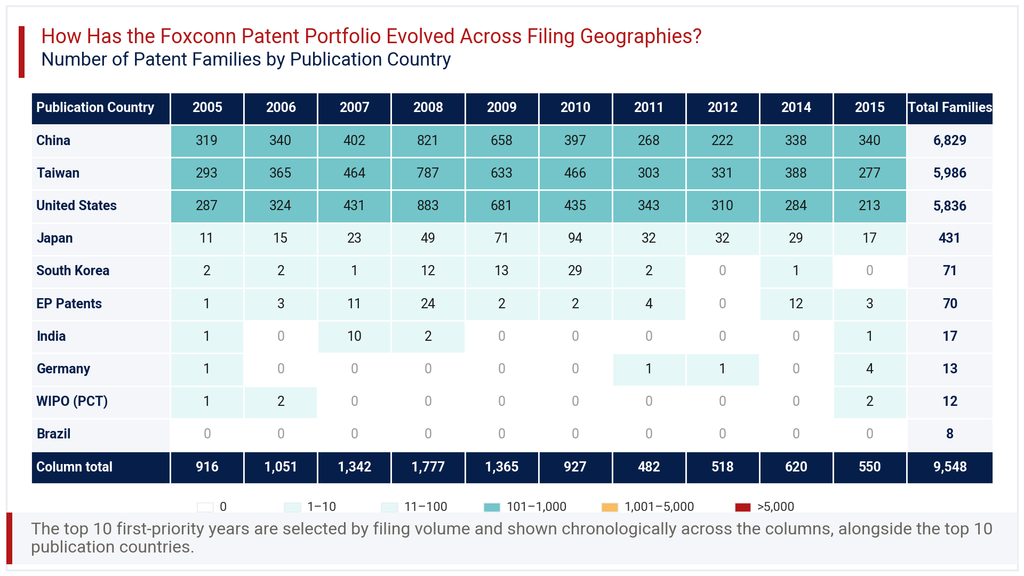
After 2009, all three core jurisdictions show consistent decline through 2015, with China falling to 340, Taiwan to 277, and the United States to 213. Smaller jurisdictions like Japan and South Korea show modest bumps around 2009 and 2010 before tapering off. This year-by-jurisdiction pattern indicates that Foxconn’s filing slowdown is not confined to one market. It reflects a broader shift in filing strategy across its entire international footprint, consistent with the overall trend decline seen industry-wide.
Consultant’s Perspective on Foxconn Patent Portfolio
Viewed as a whole, the Foxconn Patent Portfolio tells the story of a manufacturer whose patenting intensity peaked alongside its global manufacturing expansion in the mid-2000s. The heavy concentration in printed circuits, connectors, and casings aligns tightly with its contract manufacturing business model, where protecting assembly and packaging techniques carries direct commercial value. The 46.7% lapsed share is worth monitoring, since it signals a large inactive base sitting alongside a smaller, actively maintained core.
The jurisdictional concentration in China, Taiwan, and the United States, at 55.3%, 48.5%, and 47.2% respectively, makes strategic sense given Foxconn’s production and customer geography. However, the thin coverage in India, at just 0.1%, stands out given the company’s reported manufacturing expansion there. As Foxconn pushes further into electric vehicles, semiconductors, and robotics, a reasonable expectation would be rising filings in newer IPC categories beyond the legacy hardware classes. Tracking whether filing volume recovers once publication lag clears, and whether new technology clusters emerge, would be the most useful signal for competitors and partners alike.
Explore Deeper Insights with Expertlancing Research
Understanding a patent portfolio at this depth takes more than reading raw counts. Expertlancing Research helps businesses, investors, and legal teams translate patent data into decisions that matter, from licensing opportunities to competitive benchmarking and technology scouting. If you are evaluating Foxconn’s intellectual property position, or that of any competitor, our analysts can build a tailored assessment around your specific question. Reach out to Expertlancing Research to commission a deeper, validated study suited to your business needs.