


The Galanz patent portfolio offers a useful lens into how one of the world’s largest home appliance makers protects its engineering output. Across 2,645 total patent families, 64.5% remain active when granted and pending cases are counted together. Of these, 1,628 families have been granted and 78 sit pending before patent offices. The grant rate stands at 61.6%, while 939 families have lapsed, expired or been revoked. These figures reflect prosecution and maintenance status only, not a judgment on patent quality or enforceability.
Filing activity peaked in 2020, when Galanz filed 311 patent families, the highest single-year count in the portfolio. China dominates as the top jurisdiction, accounting for 99.4% of filings across 8 jurisdictions worldwide. The leading technology cluster is F24C (domestic stoves or ranges, including cooking appliances), covering 687 families. This cluster alone signals where Galanz concentrates its engineering investment most heavily.
This report draws on patent filing records to describe how Galanz builds and maintains its intellectual property position. Filing counts alone do not establish product success, market share or competitive advantage. Readers evaluating specific technology areas or planning competitive responses should validate individual patent families before relying on them for business or legal decisions. The analysis that follows is meant to guide direction, not substitute for due diligence on particular filings.
About Galanz
Company Profile: Guangdong Galanz Enterprises Co., Ltd. is a Chinese manufacturer of electronic home appliances. The company is headquartered in Foshan, Guangdong, and was founded on 28 September 1978. As of January 2019, Galanz manufactures about half of the world’s microwaves. Over the years, Galanz has expanded its product line to include air conditioners, washing machines, toaster ovens, refrigerators and other home appliances, with production bases in Zhongshan City and Shunde District employing over 50,000 people.
The company operates 13 subsidiaries at headquarters, 52 sales offices across China, and branches in Hong Kong, Japan, Korea, Europe and North America. Founded by Liang Qingde, Galanz originally traded in duck feathers before entering home appliances. By 1995 it led the Chinese microwave market with 25.1 percent share, and by 1998 it became the world’s largest microwave oven manufacturer with 40 percent global share. In 2000, Galanz entered the air conditioning and refrigeration industry.
On its official US site, the company states that Galanz operates one of the world’s largest appliance manufacturing centers and has built more than 1,600 patents alongside product partnerships with recognized American brands.
How Healthy is Galanz Patent Portfolio?
Patent portfolio health depends on how many filings survive prosecution and stay in force. Galanz shows a grant rate of 61.6%, meaning the majority of its filed families eventually secure protection. Pending cases make up only 2.9%, a modest pipeline awaiting examination outcomes. On the other side, lapsed filings account for 21.7%, revoked cases 7.8%, and expired filings 6.0%. Together these represent just over a third of the portfolio no longer in force.
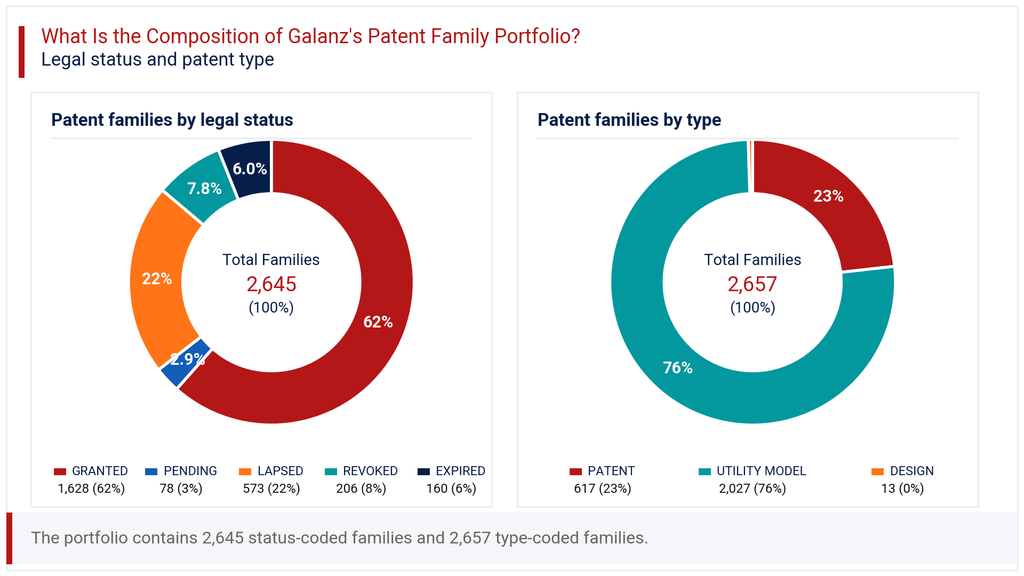
The composition chart in this section also reveals how Galanz splits its filings by patent type. Utility models dominate at 76.3%, far ahead of standard patents at 23.2% and design filings at a marginal 0.5%. This heavy tilt toward utility models is typical for Chinese manufacturers, since utility models face lighter examination and grant faster. It suggests Galanz prioritizes speed and volume of protection over the longer, more rigorous patent examination route. For a company manufacturing at scale, this approach supports rapid product iteration cycles. However, it also means a large share of the portfolio carries shorter statutory protection terms than standard patents would offer, worth factoring into any competitive assessment.
How Has the Galanz Patent Portfolio Evolved Over Time?
Patent filing trends at Galanz show distinct phases rather than one steady climb. Early filings before 2007 totalled 175 families, followed by modest annual counts through the early 2010s. Activity surged from 2016 onward, with 170 families that year, climbing to 277 in 2018 and peaking at 311 in 2020. This multi-year run reflects a period of heavy investment in filing new protection.
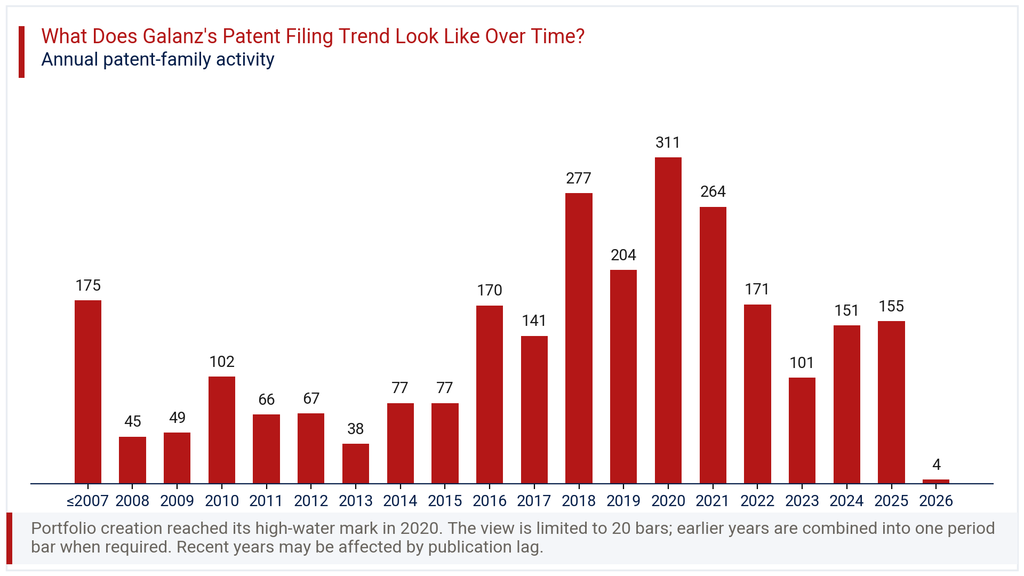
The filing-trend chart in this section shows a pullback after 2020, with counts falling to 171 in 2022 and 101 in 2023, before rising again to 151 in 2024 and 155 in 2025. The 2026 figure of 4 families, and the -97.4% change noted for the latest year, mostly reflect publication lag rather than an actual halt in filing. Patent applications typically take many months to appear in public records, so the newest one to two years will always look artificially low until data catches up. Readers should treat the recent downturn with that caveat in mind, focusing instead on the sustained high-filing years from 2016 to 2021 as the more reliable signal of Galanz’s filing intensity.
Where Does the Galanz Patent Portfolio Prioritize Patent Protection?
Patent geography for Galanz is heavily concentrated in its home market. China accounts for 99.4% of all filings, equivalent to 2,628 families, dwarfing every other jurisdiction. The United States follows at a distant 0.9% share with 24 families, and WIPO’s PCT route carries 0.5%, used mainly as a gateway for selective international filing. Canada, Japan, EP Patents, South Korea and Taiwan each contribute a handful of families, together covering 8 jurisdictions in total.
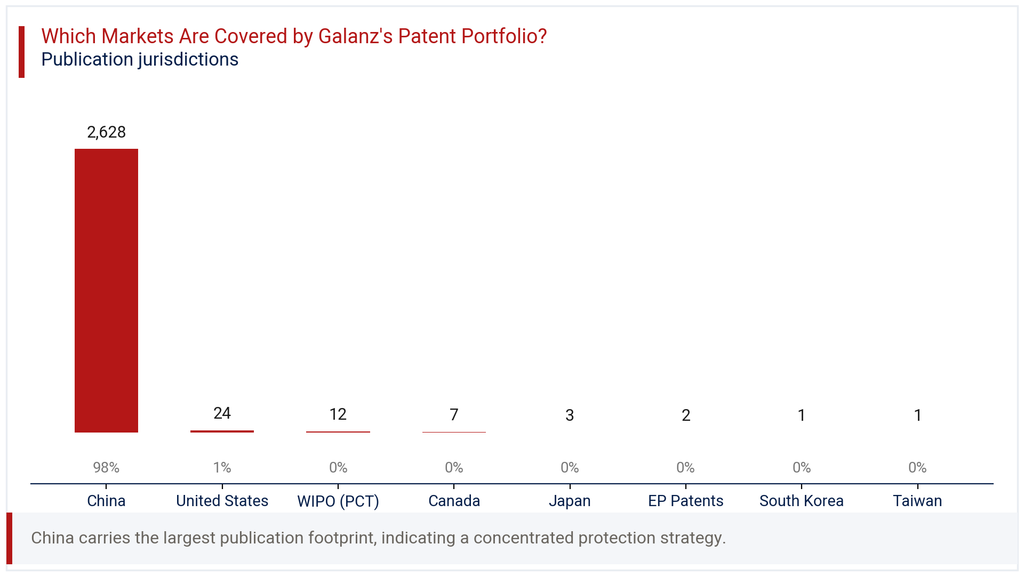
The geographic chart in this section makes clear that Galanz’s international filing footprint remains thin relative to its domestic one. This pattern is common among Chinese manufacturers whose primary production and sales volumes sit within China itself. It does not necessarily mean weak international ambition, but it does suggest that overseas patent protection has not been a filing priority to date. For competitors or partners assessing freedom-to-operate risk outside China, this concentration matters. It implies lower patent exposure for Galanz-related products sold in markets like Europe, Japan or South Korea, where filing counts remain in single digits.
Where is the Galanz Patent Portfolio Building Protection Across Key Technologies?
IPC analysis of the Galanz portfolio points to cooking and kitchen appliances as the clear technology anchor. F24C, covering domestic stoves and ranges, leads with 687 families and a 27.9% share. Close behind sits A47J, kitchen equipment such as cooking vessels and utensils, at 625 families and 25.3%. Together these two classes account for more than half the entire technology-coded portfolio.
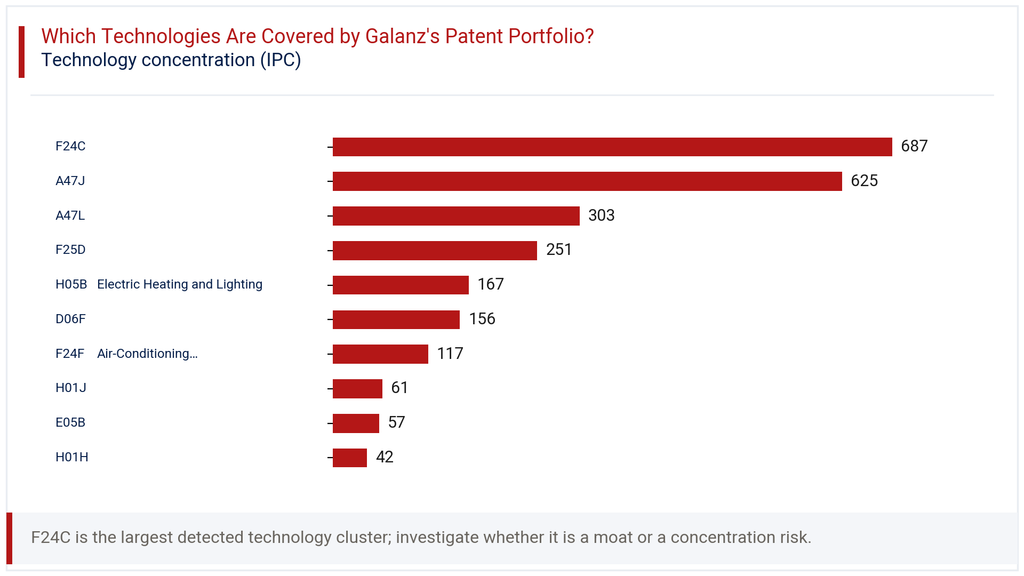
The technology chart in this section also shows meaningful depth in adjacent categories. A47L (cleaning equipment) holds 303 families at 12.3%, while F25D (refrigeration) carries 251 families, or 10.2%. Smaller but notable clusters include H05B electric heating and lighting at 6.8%, D06F laundry equipment at 6.3%, and F24F air-conditioning and humidification at 4.7%. This spread confirms Galanz’s patent protection tracks its actual product categories closely, from microwaves and cookers through to laundry and climate control. The concentration in cooking-related classes reinforces where the company’s core engineering effort and competitive differentiation likely remain strongest.
How Has the Galanz Patent Portfolio Evolved Across Filing Geographies?
Viewing filings by year and jurisdiction together sharpens the geography story considerably. China’s domestic filings track the overall portfolio trend closely, rising from 102 in 2010 to 323 in 2020, the single highest year-country count in the data. Even during the post-2020 decline, China continued filing at meaningful volumes, with 170 in 2022 and 155 in 2025.
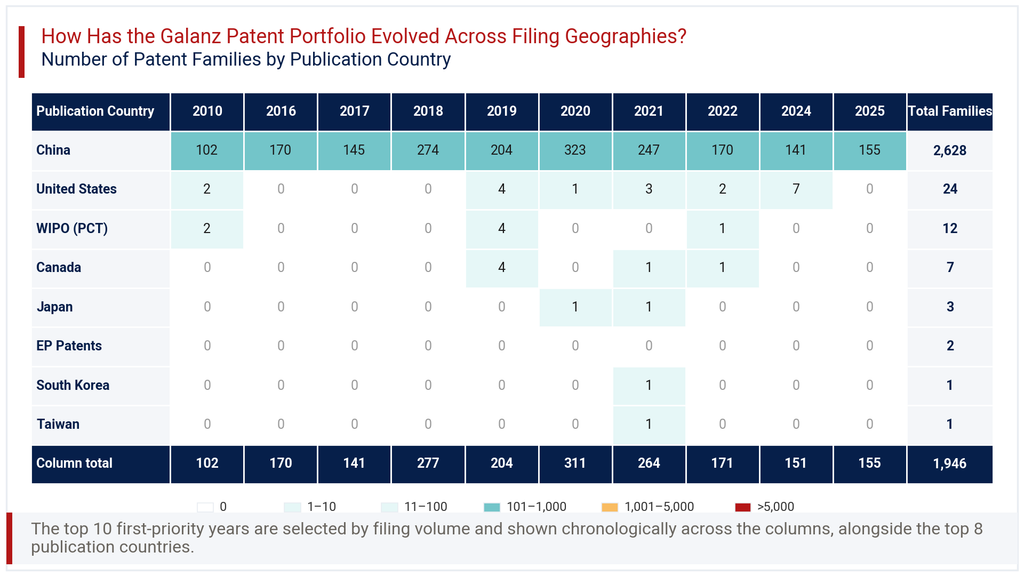
The heatmap in this section shows that international filings never scaled alongside domestic ones. The United States saw small upticks, such as 7 families in 2024, but nothing resembling sustained international expansion. Canada, Japan, South Korea and Taiwan each appear only in isolated years with single-digit counts, often just 1 family. WIPO’s PCT filings peaked modestly at 4 in 2019 before tapering off entirely in later years. This pattern suggests Galanz’s international filing strategy has been opportunistic rather than programmatic, activated for specific products or markets rather than pursued as a consistent year-on-year priority alongside its domestic filing engine.
Consultant’s Perspective on Galanz Patent Portfolio
Taken together, the Galanz patent portfolio tells a story of a manufacturer defending its home-market position with considerable intensity. A grant rate of 61.6% and an active rate of 64.5% point to a functioning filing operation, not a dormant one. The heavy reliance on utility models, at 76.3% of all filings, reinforces that Galanz optimizes for fast, incremental protection suited to its manufacturing cadence rather than slower, broader patent claims.
The geographic imbalance is the most important signal for outside observers. With 99.4% of filings in China, Galanz’s intellectual property position outside its home market remains thin. Any competitor assessing risk in North America, Europe or other export markets should note this gap carefully. It may reflect lower perceived need for protection abroad, or simply a filing strategy not yet caught up with export ambitions.
Going forward, Galanz would benefit from building a more deliberate international filing program, particularly around its stronger technology clusters in cooking and refrigeration. Given rising appliance trade tensions globally, stronger protection in key export markets could reduce future freedom-to-operate risk and strengthen licensing leverage. Monitoring how the portfolio evolves in the next two to three years, once publication lag clears, will be instructive.
Explore Deeper Insights with Expertlancing Research
Understanding a patent portfolio at this level of detail takes more than reading headline numbers. Expertlancing Research helps clients go further, validating individual patent families, benchmarking against competitors, and assessing freedom-to-operate risk across target markets. Whether the goal is competitive intelligence, licensing strategy or acquisition due diligence, our analysts turn raw filing data into decisions you can act on. Reach out to Expertlancing Research to commission a deeper, customized review of any portfolio discussed here.