


The Great Wall Patent Portfolio offers a useful window into how one of China’s largest automakers protects its engineering and design work. Across 36,080 total patent families, 73.1% remain active, a figure that covers both granted and pending filings. Granted patents account for 18,317 of the total, while 8,045 families are still pending examination. The grant rate stands at 50.8%, and a combined 9,718 families fall under lapsed, revoked, or expired status. These figures reflect prosecution and maintenance outcomes only, not a judgment on patent quality or enforceability.
Filing activity peaked in 2024, when Great Wall recorded 5,431 new families, capping a sustained climb through the preceding decade. China dominates the jurisdictional footprint, holding 99.5% of all filings across a portfolio spread over 10 jurisdictions. On the technology side, B60R Vehicle Fittings leads all classifications with 4,632 families, making it the single largest cluster in the company’s filing activity.
This report draws on structured patent data to describe filing patterns, legal status, and technology concentration. It does not measure commercial success, product adoption, or competitive strength on its own. Readers evaluating specific families for licensing, litigation, or investment purposes should verify details directly against primary patent office records before relying on them externally.
About Great Wall
Company Profile: Great Wall Motor Company Limited, trading as GWM, is a Chinese automobile manufacturer headquartered in Baoding, Hebei, China. Named after the Great Wall of China, the company largely produces sport-utility vehicles and pick-up trucks, as well as trucks. It is one of the top ten Chinese automobile manufacturers, with 1.23 million vehicles sold globally in 2024. GWM was founded in 1984 as a small manufacturer partly owned by a local government in Hebei, and Wei Jianjun grew the company into a leading pickup truck manufacturer. The company was privatized in 1998 and went public on the Hong Kong Stock Exchange in 2003. It manufactures and sells vehicles under multiple brands, including GWM, Haval, Wey, Tank, Poer, and Ora. Revenue reached CN¥173.21 billion in 2023. The company reports an international sales network spanning more than 170 countries and regions, with cumulative overseas sales of more than 1.4 million vehicles.
It also operates a European headquarters in Munich.
How Healthy is Great Wall Patent Portfolio?
The composition chart for Great Wall shows a portfolio weighted toward active protection. Granted patents make up 50.8% of all families, and pending applications contribute another 22.3%, together driving the 73.1% active rate. This split suggests a filing office that continues to examine and approve work at a steady pace, rather than one sitting on a backlog of stale applications. Lapsed filings account for 17.6%, while revoked and expired families sit at 5.7% and 3.6% respectively. These are routine outcomes in any large patent portfolio health profile and do not, by themselves, signal weakness.
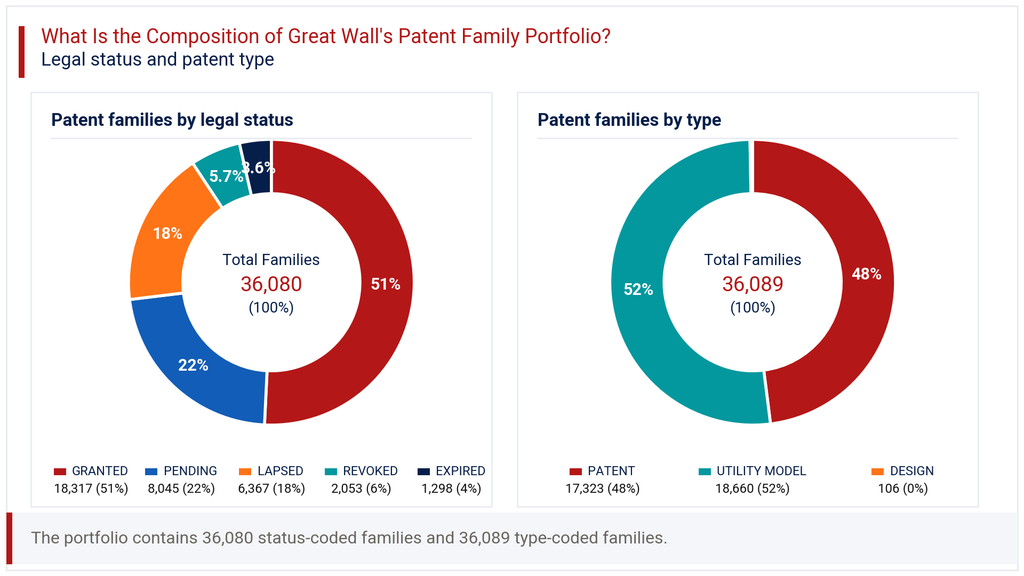
Looking at patent type, utility models represent 51.7% of filings against 48.0% for standard patents, with design filings a minor 0.3%. This balance reflects a common approach among Chinese manufacturers, where utility models offer faster, lower-cost protection for incremental engineering improvements. The heavier utility model share indicates Great Wall protects a large volume of practical, component-level innovations alongside more substantive patent claims. For a reader assessing patent legal status at a glance, the picture is one of an actively maintained, examination-heavy portfolio rather than a dormant filing archive.
How Has the Great Wall Patent Portfolio Evolved Over Time?
The filing-trend chart tells a clear growth story. Annual filings rose from just 68 in 2008 to 1,260 by 2014, then accelerated sharply after 2020. Filings jumped from 2,084 in 2020 to 4,516 in 2022, before reaching the portfolio peak of 5,431 in 2024. This pattern points to a deliberate scaling of R&D output over roughly a decade, consistent with Great Wall’s expansion into new vehicle platforms and overseas markets.
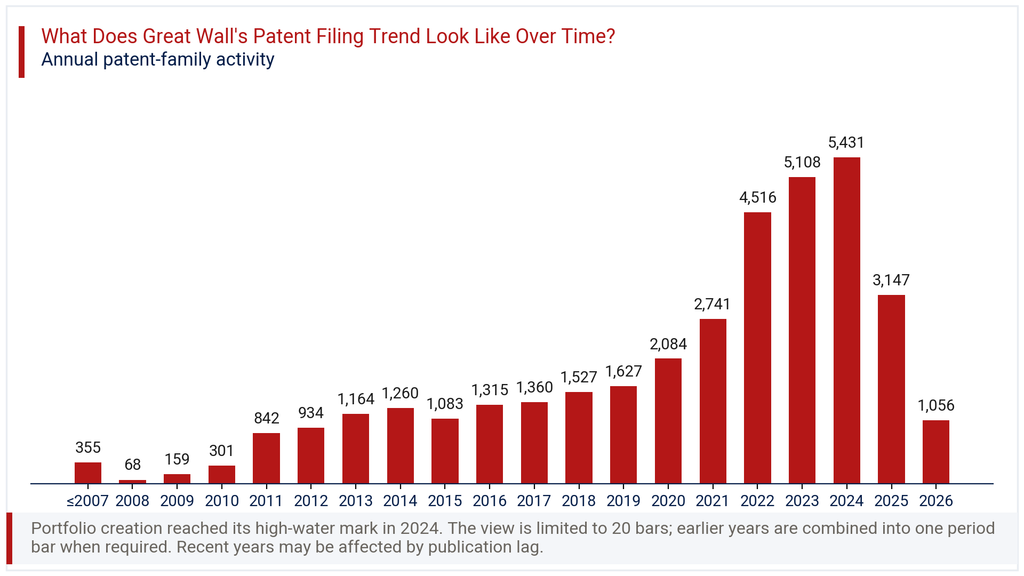
The more recent years warrant a careful read. Filings fell to 3,147 in 2025 and 1,056 in 2026, with the latest year showing a -66.4% change. Rather than reflecting an actual pullback in innovation, this drop almost certainly reflects publication lag, since patent applications typically take many months to appear in public databases after filing. Readers studying patent filing trends should treat the last one to two years as provisional and incomplete. The underlying trajectory through 2024 still points to sustained, accelerating investment in protected technology development.
Where Does the Great Wall Patent Portfolio Prioritize Patent Protection?
The geographic chart makes Great Wall’s home-market concentration unmistakable. China accounts for 99.5% of all filings, equivalent to 35,885 families out of the total portfolio. This level of domestic concentration is typical for Chinese manufacturers whose primary production and sales base remains anchored at home, even as overseas vehicle sales grow.
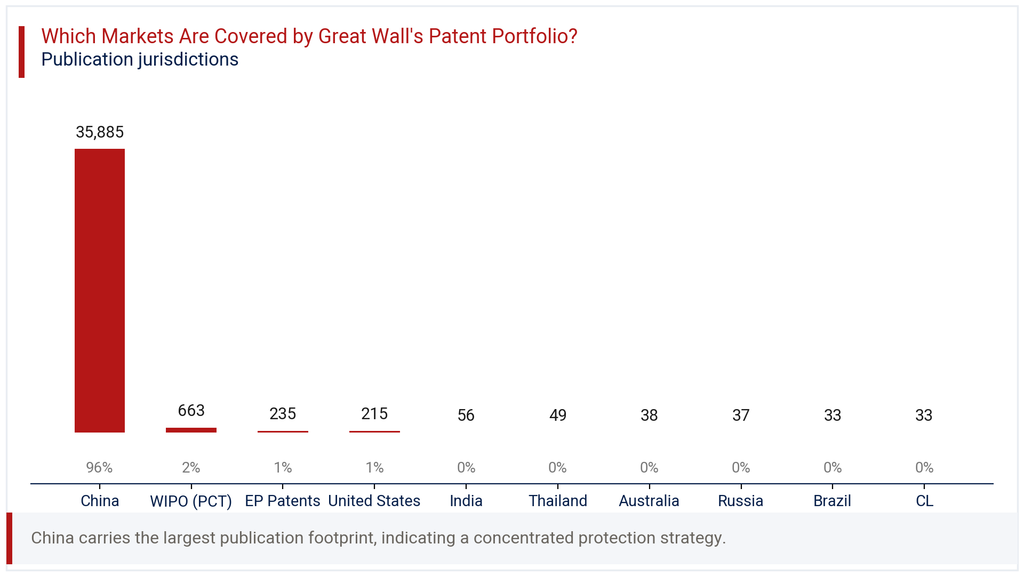
International filing remains modest by comparison. WIPO PCT applications total 663 families, representing 1.8% of the portfolio, offering a pathway to future protection in multiple markets. European patents stand at 235 families (0.7%), and United States filings reach 215 families (0.6%). Smaller jurisdictions, including India, Thailand, Australia, Russia, Brazil, and Chile, each hold a 0.1% to 0.2% share. This patent geography suggests Great Wall has prioritized securing its domestic position first, with selective international filing likely tied to specific export markets or joint venture arrangements rather than broad global coverage.
Where is the Great Wall Patent Portfolio Building Protection Across Key Technologies?
The technology chart in this section highlights a portfolio firmly rooted in vehicle hardware and systems engineering. B60R Vehicle Fittings leads with 4,632 families, or 21.4% of total filings, followed by B62D (vehicle body and steering structures) at 3,879 families and 17.9%. B60K, covering propulsion unit arrangements, adds 2,432 families at 11.2%.
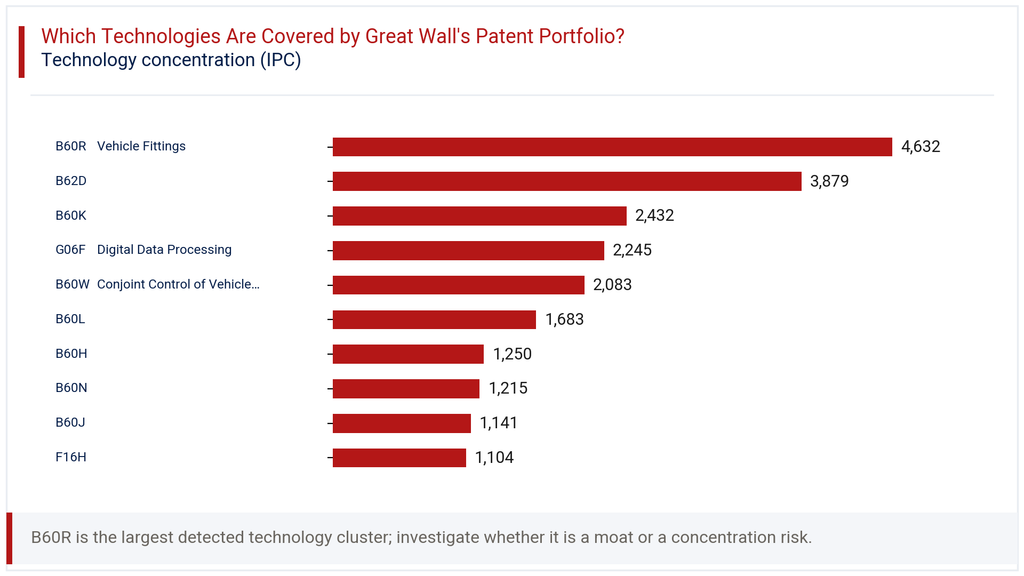
Notably, G06F Digital Data Processing ranks fourth with 2,245 families and 10.4%, signaling meaningful investment in software and electronics alongside mechanical engineering. B60W, covering conjoint control of vehicle sub-units, contributes 2,083 families at 9.6%, pointing to work on integrated vehicle control systems. Rounding out the top ten, B60L (electric propulsion) holds 7.8%, while B60H, B60N, B60J, and F16H each sit between 5.1% and 5.8%. This IPC analysis shows a portfolio balanced between traditional mechanical vehicle components and growing digital and electric vehicle capability, mirroring the wider shift across the automotive sector.
How Has the Great Wall Patent Portfolio Evolved Across Filing Geographies?
The heatmap view of filings by year and jurisdiction reinforces the earlier geographic pattern. China’s filings climbed steadily from 1,311 in 2016 to 5,423 in 2024, closely tracking the portfolio’s overall growth curve. No other jurisdiction comes close to matching this scale or consistency over the same period.
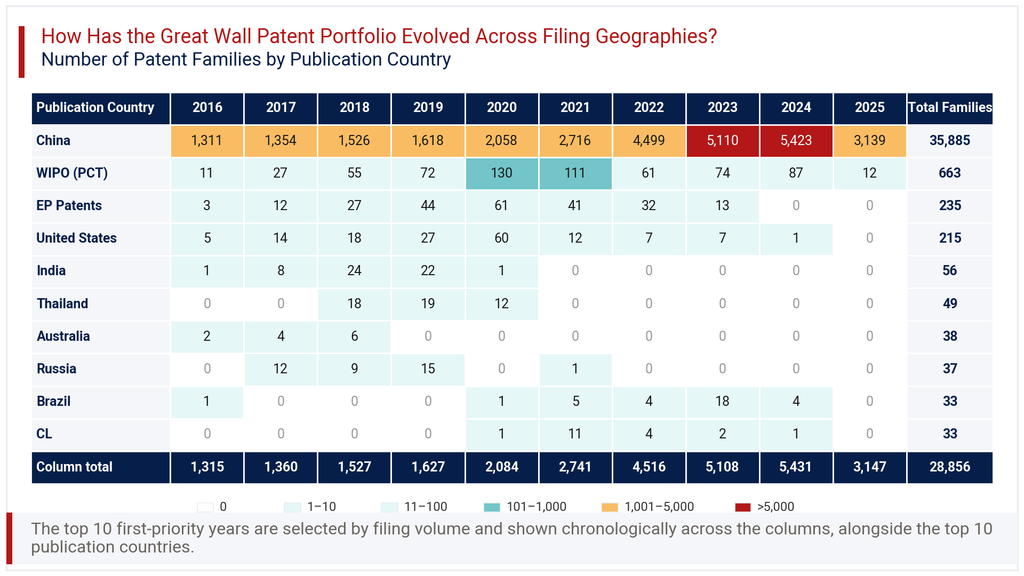
International activity tells a more mixed story. United States filings peaked at 60 in 2020 before falling sharply to just 1 by 2024. European filings followed a similar pattern, rising to 61 in 2020, then declining to 0 by 2024. India and Thailand show brief filing windows between 2017 and 2020, with no activity recorded afterward. WIPO PCT filings have stayed more consistent, ranging between 11 and 130 annually, suggesting this route remains Great Wall’s preferred mechanism for preserving international filing options. The uneven overseas pattern suggests shifting market priorities or changing reliance on international IP strategy rather than one steady global expansion plan.
Consultant’s Perspective on Great Wall Patent Portfolio
Taken as a whole, the Great Wall Patent Portfolio reflects a company firmly focused on scaling domestic innovation first. The filing volume, now exceeding 36,080 families, and the steep rise through 2024 both point to an R&D engine operating at serious scale. The 73.1% active rate confirms this is a living, maintained portfolio rather than a legacy archive.
The concentration in China, at 99.5% of filings, is the single most important strategic signal here. For a company reporting sales across more than 170 countries, the gap between commercial reach and international patent coverage stands out. Markets like the United States and Europe show declining recent filings, which could reflect a recalibrated approach to overseas IP investment, cost considerations, or a shift toward trade secret protection in select markets.
Going forward, the technology mix in G06F and B60W classes deserves close attention, since digital and control systems will likely define competitive differentiation in electric and connected vehicles. Great Wall’s overseas ambitions would benefit from a more deliberate international filing strategy, particularly in markets central to its export growth plans. Monitoring how PCT filings convert into national phase entries over the next two years will be a useful indicator of intent.
Explore Deeper Insights with Expertlancing Research
This overview only scratches the surface of what the Great Wall Patent Portfolio reveals about technology direction and market priorities. Expertlancing Research helps clients go further, with detailed competitive benchmarking, white space analysis, and custom patent landscape studies tailored to specific business questions. Whether you are assessing acquisition targets, tracking a competitor, or planning your own filing strategy, our team can help translate this data into decisions you can act on. Reach out to start a conversation.