


The H3C Technologies patent portfolio spans 12,903 patent families, offering a window into how this Chinese digital solutions provider protects its technology investments. Of these families, 73.8% remain active, a figure that covers both granted and pending cases. The portfolio holds 7,427 granted patents and 2,096 pending applications, translating into a grant rate of 57.6%. The remaining families, totaling 3,380, are lapsed, expired, or revoked. These figures describe prosecution and maintenance status only, not a judgment on patent quality or enforceability.
Filing activity peaked in 2018, when the company filed 1,032 patent families, the highest single-year count in the dataset. China dominates the jurisdictional footprint, accounting for 99.6% of filings, while the portfolio extends across 10 jurisdictions in total. On the technology side, H04L Digital Information Transmission leads by a wide margin, with 8,765 families, making it the clear anchor of H3C’s innovation focus.
This report draws on patent filing records to map where H3C Technologies has concentrated its research and protection efforts over time. Filing counts alone do not confirm commercial success, market leadership, or competitive advantage in any given segment. Readers evaluating specific technology areas or individual families for transactional, licensing, or competitive purposes should validate those details independently before relying on them externally.
About H3C Technologies
Company Profile: H3C, officially New H3C Group, is a Chinese digital solutions provider headquartered in Hangzhou, China. The company describes itself as the leader in digital and AI solutions, committed to becoming the most trusted partner for customers in business innovation and digital transformation. H3C states that through deep layout across the “cloud-networking-security-computing-storage-terminal” chain, it is continuously improving digitalisation and intelligence capabilities. The company reports over 30 years of operation and says it has firmly oriented itself toward customer needs across many countries and regions.
H3C originated from the Huawei-3Com joint venture and was later integrated with HP’s China server business, forming New H3C Group under Tsinghua Unigroup’s Unisplendour subsidiary. In 2026, H3C introduced 102.4T single-chip AI switches alongside what it called the world’s first enterprise-grade Wi-Fi 8 access point. The company continues active product development in networking, AI infrastructure, and campus solutions.
How Healthy is H3C Technologies Patent Portfolio?
Patent portfolio health depends on how many filings convert to granted rights and how many remain in force. H3C’s legal status mix shows 57.6% granted, 16.2% pending, 14.1% lapsed, 9.8% revoked, and 2.3% expired. Together, granted and pending cases produce an active rate of 73.8%, a reasonably strong figure for a portfolio of this size. The composition chart in this section lays out this split clearly, showing that more than half the portfolio has already cleared examination successfully.
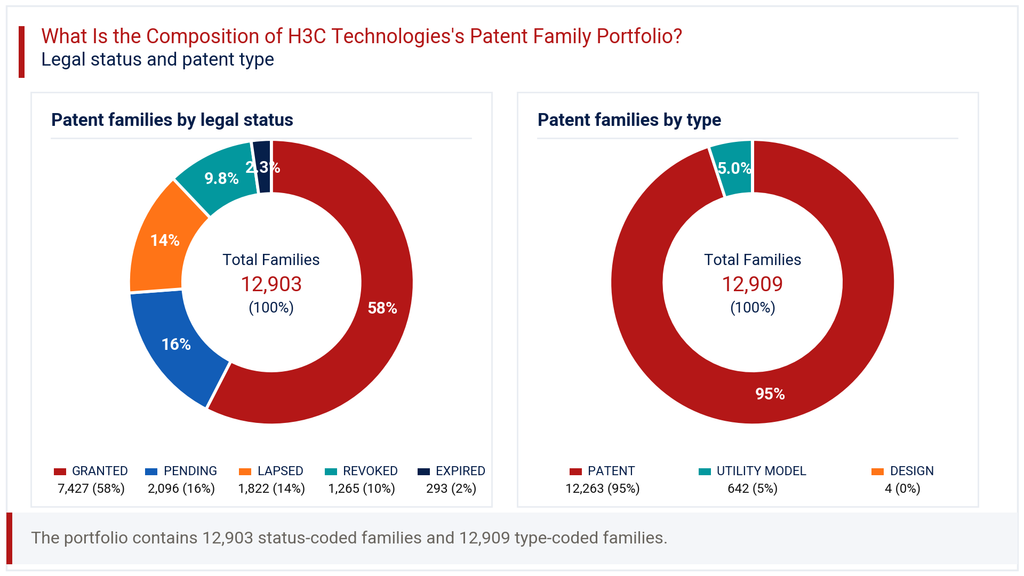
On patent type, the portfolio leans heavily toward utility patents, which make up 95.0% of filings. Utility models account for 5.0%, while design filings are negligible at effectively 0.0%. This mix suggests H3C’s protection strategy centers on functional and technical inventions rather than aesthetic or short-cycle utility model filings, typical for a networking and infrastructure technology company. The relatively low revoked and expired share, compared to the active base, points to a portfolio that has been maintained with some discipline. That said, the 9.8% revoked share deserves attention, as it may reflect contested claims or examination outcomes worth a closer look by anyone assessing specific families.
How Has the H3C Technologies Patent Portfolio Evolved Over Time?
H3C’s patent filing trends show a company with decades of sustained activity. Filings before 2007 already stood at 905, and annual volumes have fluctuated since, dipping to 358 in 2008 before climbing steadily through the following decade. The filing-trend chart in this section shows a clear high point in 2018, with 1,032 families filed, the single busiest year across the entire record.
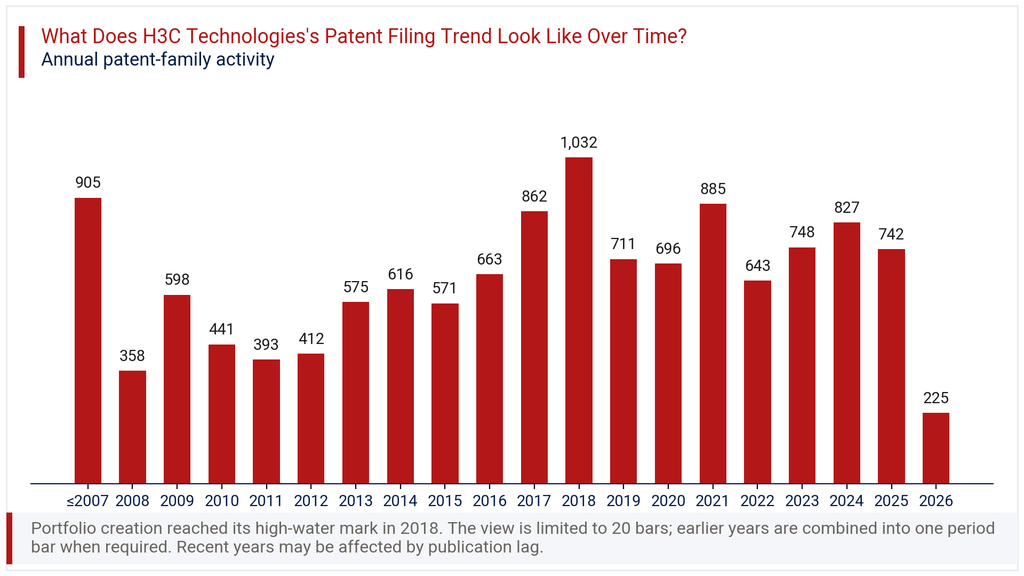
After 2018, volumes moderated but stayed substantial, with 885 families in 2021 and 827 in 2024. The most recent two years, 2025 and 2026, show 742 and 225 families respectively, reflecting a latest_year_change_pct of -69.7%. This drop should be read with caution rather than as a genuine pullback in research output. Patent applications typically take months, sometimes years, to appear in public databases, so recent filing years are structurally undercounted until records catch up. The broader pattern, spanning nearly two decades, points to a company that has filed consistently rather than in short bursts, which usually signals an ongoing, institutionalized approach to intellectual property rather than one tied to a single product cycle.
Where Does the H3C Technologies Patent Portfolio Prioritize Patent Protection?
Patent geography for H3C is heavily concentrated at home. China accounts for 99.6% of all filings, by far the dominant jurisdiction in the portfolio. This reflects the company’s primary market and manufacturing base, and is typical for Chinese technology companies at this filing scale. The geographic chart in this section shows just how steep the drop-off is once filings move outside China.
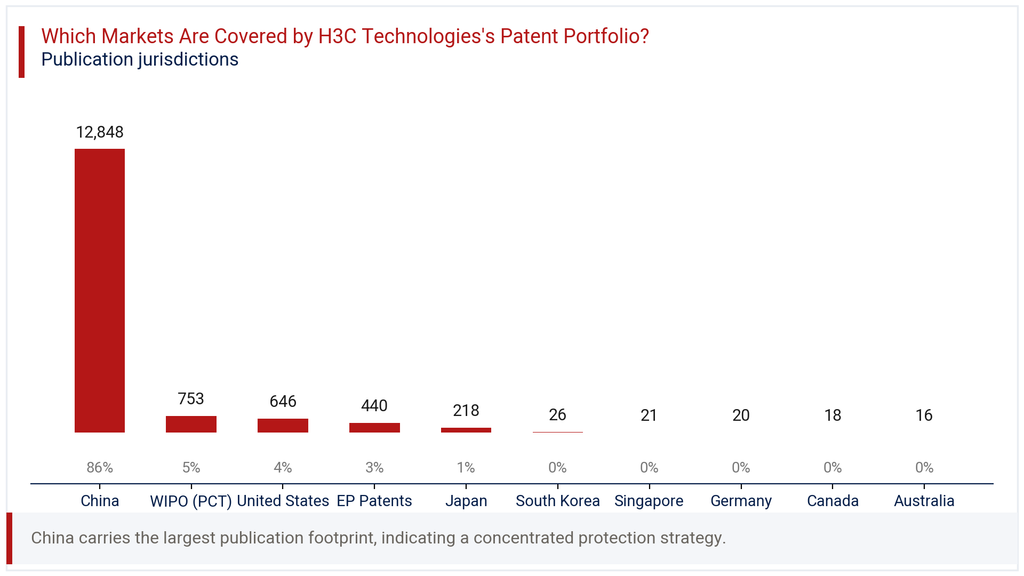
Beyond China, the WIPO PCT route carries 5.8% of filings, functioning as a bridge toward potential international protection. The United States follows at 5.0%, and European filings sit at 3.4% through the EP route. Japan holds 1.7%, while South Korea, Singapore, Germany, Canada, and Australia each register under 0.3%. Filings span 10 jurisdictions in total, a footprint that signals international awareness without deep multi-market filing commitment. For a company positioning itself around global digital and AI solutions, this jurisdictional spread suggests international protection remains selective, likely reserved for technologies tied to specific export markets or partnerships rather than broad-based global filing.
Where is the H3C Technologies Patent Portfolio Building Protection Across Key Technologies?
IPC analysis of H3C’s portfolio reveals a strong concentration in communications technology. H04L Digital Information Transmission leads decisively with 8,765 families, representing 62.8% of the entire portfolio. This single class covers digital transmission protocols and networking infrastructure, aligning closely with H3C’s core networking and switching business. The technology chart in this section shows just how dominant this category is relative to every other class tracked.
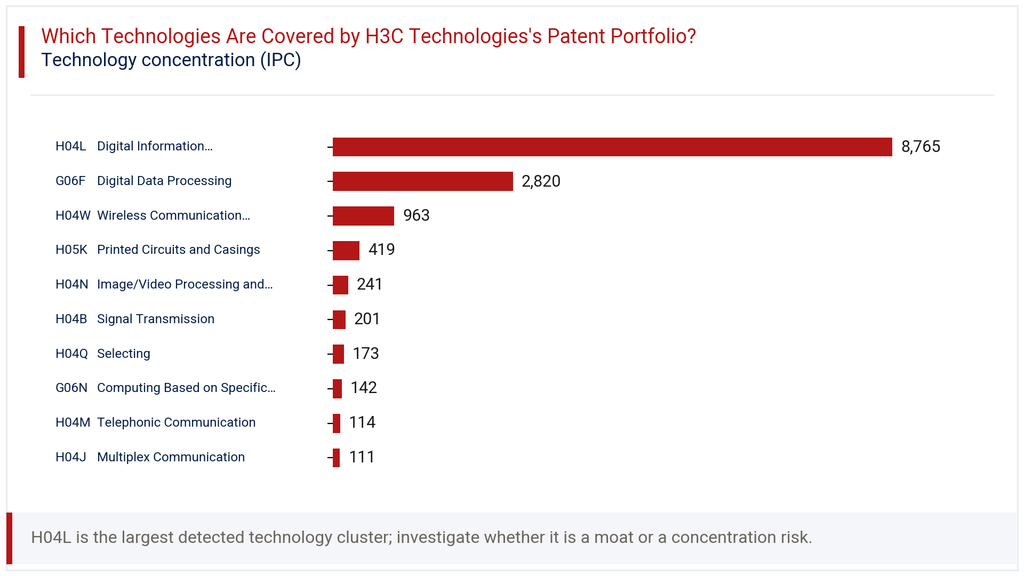
G06F Digital Data Processing ranks second with 2,820 families, or 20.2% of filings, reflecting investment in computing and data handling technologies. H04W Wireless Communication Networks follows at 6.9%, with 963 families, pointing to meaningful work in wireless infrastructure. Smaller but notable clusters include H05K Printed Circuits and Casings at 3.0% and H04N Image/Video Processing and Display at 1.7%. Together, the top three classes account for close to 90% of the portfolio, indicating that H3C’s research investment is tightly focused on networking, computing, and wireless rather than spread thinly across unrelated fields. This concentration mirrors the company’s stated focus on the cloud-networking-security-computing chain.
How Has the H3C Technologies Patent Portfolio Evolved Across Filing Geographies?
Looking at filings by year and jurisdiction together tells a more nuanced story than totals alone. The heatmap in this section shows China’s filings tracking the overall portfolio trend closely, rising from 571 in 2013 to a peak of 1,031 in 2018, then settling around 700-800 annually in recent years. This consistency confirms China as the steady backbone of filing activity throughout the period.
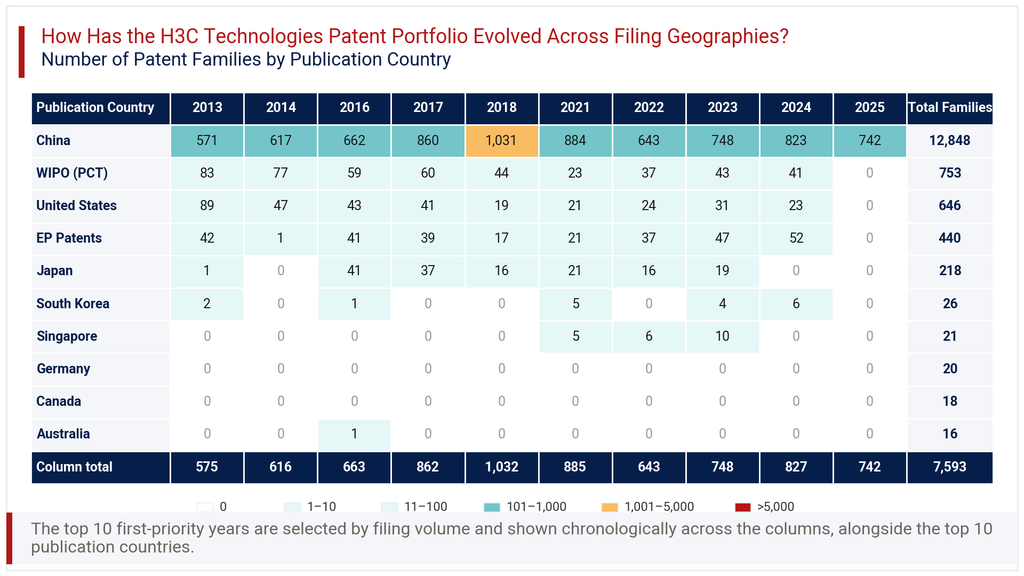
International filings tell a different story. WIPO PCT filings dropped from 83 in 2013 to single digits by 2021, before a modest recovery to 43 in 2023. United States filings followed a similar declining pattern, falling from 89 in 2013 to 23 by 2024. European filings via EP showed more resilience, rising to 52 in 2024 after a volatile middle period. Japan filings stopped appearing after 2023, and smaller jurisdictions like Singapore and South Korea show only sporadic activity. This pattern suggests H3C’s international filing strategy has become more selective over time, possibly prioritizing Europe over the US and Japan in recent years, worth watching as a signal of shifting market priorities.
Consultant’s Perspective on H3C Technologies Patent Portfolio
Reviewing the H3C Technologies patent portfolio, a few patterns stand out beyond the raw numbers. The scale, 12,903 families, confirms a company with genuine, sustained research investment rather than opportunistic filing. The concentration in digital transmission and data processing technologies, at 62.8% and 20.2% respectively, reflects focused execution rather than diversification for its own sake. This is a company that knows its core business and protects it accordingly.
The jurisdictional pattern raises a question worth monitoring. With 99.6% of filings in China and international filing volumes softening in the US and Japan, H3C’s global IP footprint has not kept pace with its stated ambitions in digital and AI solutions across many countries. Companies aiming for broader international market presence typically need patent protection that mirrors those ambitions. The active rate of 73.8% is healthy, but the 9.8% revoked share and recent publication lag mean the true current state of near-term filings is not yet fully visible. Anyone assessing this portfolio for partnership, competitive benchmarking, or investment purposes should track whether international filing activity, particularly in Europe and emerging markets, picks up over the next two to three years as a signal of broader strategic intent.
Explore Deeper Insights with Expertlancing Research
This overview offers a starting point, not the full picture. Patent portfolios carry nuance that aggregate figures cannot capture, from claim scope to litigation history to technology-specific competitive positioning. Expertlancing Research helps businesses go beyond the numbers with tailored patent landscape studies, competitor benchmarking, and technology-specific due diligence. Whether you are evaluating a partnership, assessing competitive risk, or scoping an acquisition, our analysts can build the detailed, validated intelligence your decision requires. Reach out to discuss how we can support your next research requirement.