

The Hengdian Patent Portfolio offers a useful lens into how one of China’s largest private conglomerates protects its technology investments. Across 6,396 total patent families, the portfolio shows an active rate of 56.1%, covering both granted and pending cases. Of these, 2,780 families have been granted and 811 remain pending, giving a grant rate of 43.5%. The remaining families, numbering 2,805 when lapsed, revoked, and expired cases are combined, reflect the natural attrition seen in any mature filing program. These figures describe prosecution and maintenance status only, not a judgment on patent quality or enforceability.
Filing activity peaked in 2020, when Hengdian recorded 665 new families, the highest single-year count in the portfolio’s history. China dominates the jurisdictional footprint, accounting for 93.7% of all filings across 10 jurisdictions tracked in this analysis. The leading technology cluster is H01F, covering inductors, magnets, and transformers, with 931 families, making it the single largest area of patent concentration for the group.
This report draws on filing and legal-status data to describe how Hengdian has built and managed its patent estate over time. Filing counts alone do not establish commercial success, product adoption, or competitive advantage in any given market. Readers considering licensing, partnership, or competitive benchmarking decisions should independently verify specific patent families before relying on them externally. The analysis that follows is meant to orient, not substitute for, deeper legal or technical due diligence.
About Hengdian
Company Profile: Hengdian Group is a Chinese private conglomerate founded in 1975 in Hengdian, Zhejiang. Founded in 1975 in Hengdian, Zhejiang, Hengdian Group is today one of China’s largest private enterprises. It operates across four core business areas: electricals and electronics, pharmaceuticals and healthcare, film and entertainment, and modern and financial services. Since 1996, Hengdian Group has operated Hengdian World Studios, one of the largest film studios in the world.
Its diversified operations span research and development, manufacturing, sales, and after-sales service, with a commercial footprint covering over 150 countries and regions. In 2024, Hengdian Group generated nearly 100 billion CNY in annual revenue. The group was founded by entrepreneur Xu Wenrong. Its subsidiaries include DMEGC Magnetics, Apeloa Pharmaceutical, Innuovo Technology, and TOSPO Lighting, reflecting its diversified industrial base spanning magnetics, pharmaceuticals, electronics, and entertainment sectors.
How Healthy is Hengdian Patent Portfolio?
Patent portfolio health depends on how filings move through their legal lifecycle, and Hengdian’s numbers tell a mixed story. Granted patents make up 43.5% of the portfolio, while pending applications account for 12.7%. Together these active cases represent 56.1% of total families, a reasonable proportion for a conglomerate operating across multiple industrial segments. The composition chart in this section shows the remaining share split between lapsed (22.0%), revoked (11.5%), and expired (10.3%) cases.
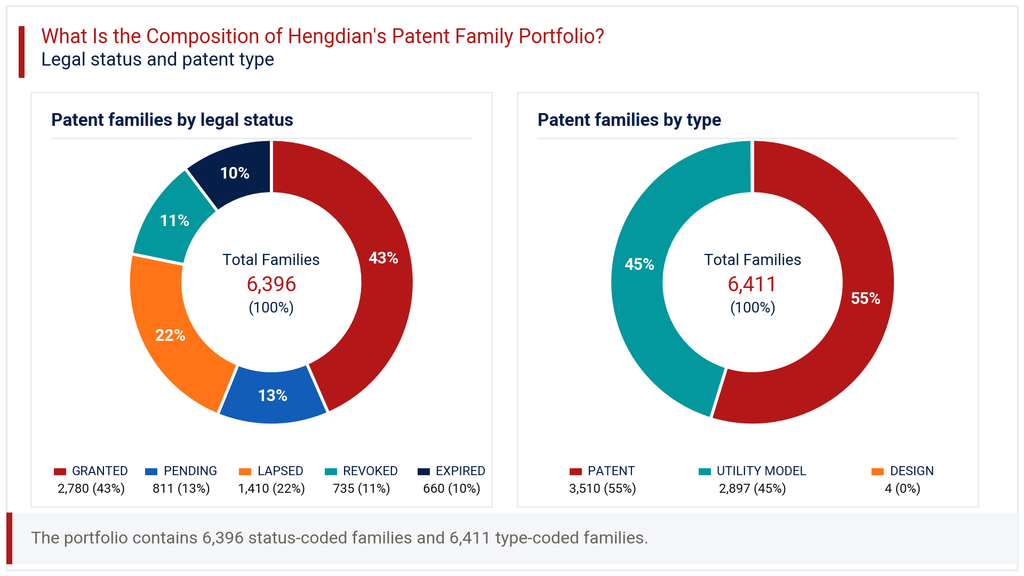
This level of attrition is not unusual for a portfolio this size, but it does suggest selective pruning rather than blanket maintenance. On patent type, traditional patents account for 54.7% of filings, with utility models close behind at 45.2%, and design filings forming a negligible 0.1%. This split points to a filing strategy weighted toward incremental, utility-model-style protection alongside invention patents, typical of Chinese industrial conglomerates balancing speed to filing with depth of protection. The legal status mix overall indicates a portfolio under active management rather than passive accumulation.
How Has the Hengdian Patent Portfolio Evolved Over Time?
Patent filing trends across the Hengdian Patent Portfolio reveal a steady climb from modest beginnings to a clear high point. Early filings stayed under 100 families annually through much of the 2008 to 2010 period. Momentum built steadily from 2011 onward, with filings crossing 500 annually by 2018. The filing-trend chart in this section shows the portfolio peaking in 2020 at 665 families, following several years of sustained growth.
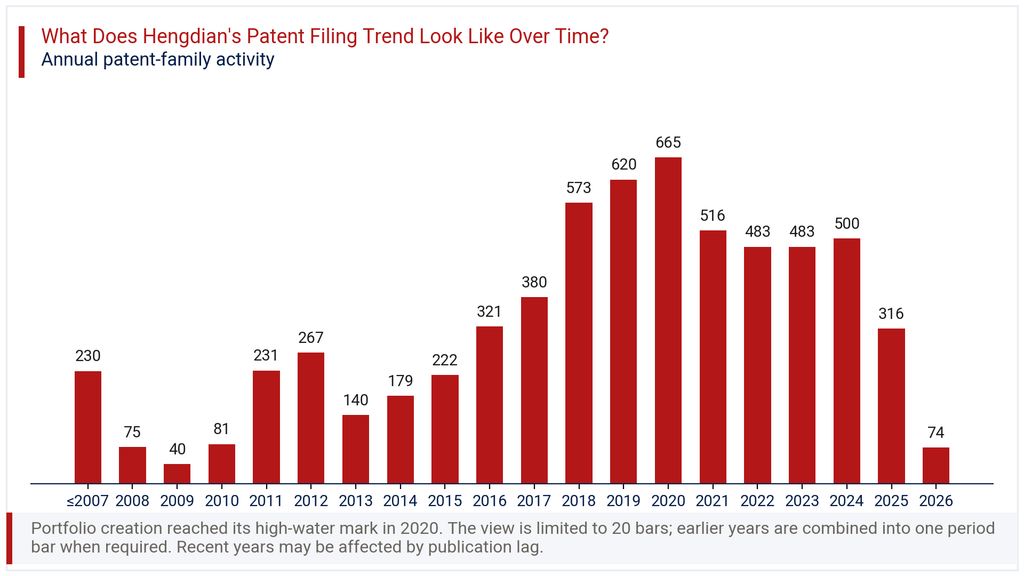
Filings have moderated since that peak, settling between 483 and 500 annually from 2022 through 2024. The apparent drop to 316 in 2025 and 74 in 2026, reflecting a -76.6% change versus the prior year, is best read as publication lag rather than a genuine pullback. Patent applications typically take 18 months or longer to appear in public databases, so the most recent one to two years will always understate true filing activity. The broader decade-long trend still points to a maturing, well-established filing program rather than a declining one.
Where Does the Hengdian Patent Portfolio Prioritize Patent Protection?
Patent geography within the Hengdian Patent Portfolio is heavily concentrated at home. China accounts for 93.7% of all filings, consistent with a domestically focused manufacturing and industrial group. The geographic chart in this section shows a steep drop-off after China, with Australia a distant second at 6.0% of filings. WIPO PCT applications, representing international filing intent, make up 2.6% of the total.
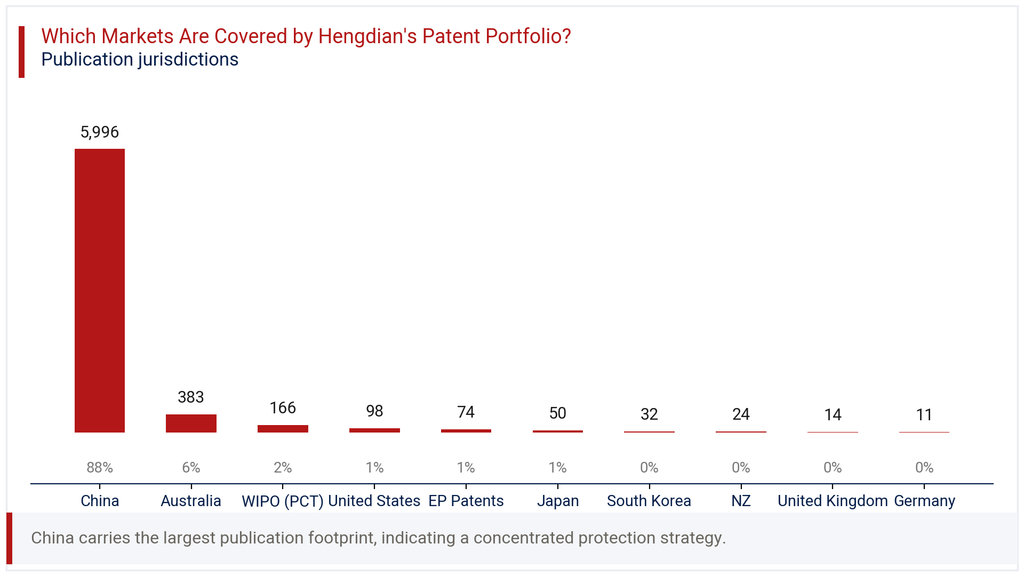
The United States (1.5%), EP Patents (1.2%), Japan (0.8%), South Korea (0.5%), New Zealand (0.4%), the United Kingdom (0.2%), and Germany (0.2%) round out a modest international presence. This pattern suggests Hengdian treats overseas filing as a selective exercise, reserved for specific markets rather than broad global coverage. For a conglomerate with commercial operations spanning over 150 countries, this filing concentration implies that patent protection is not the primary tool used to secure international markets, with trade, licensing, or manufacturing partnerships likely playing a larger role instead.
Where is the Hengdian Patent Portfolio Building Protection Across Key Technologies?
IPC analysis of the Hengdian Patent Portfolio points to a clear concentration in electromagnetic and lighting technologies. The technology chart in this section shows H01F, covering inductors, magnetic cores, and transformers, leading with 931 families, or 23.4% of the portfolio. This aligns closely with the group’s DMEGC Magnetics subsidiary and its magnetics manufacturing business.
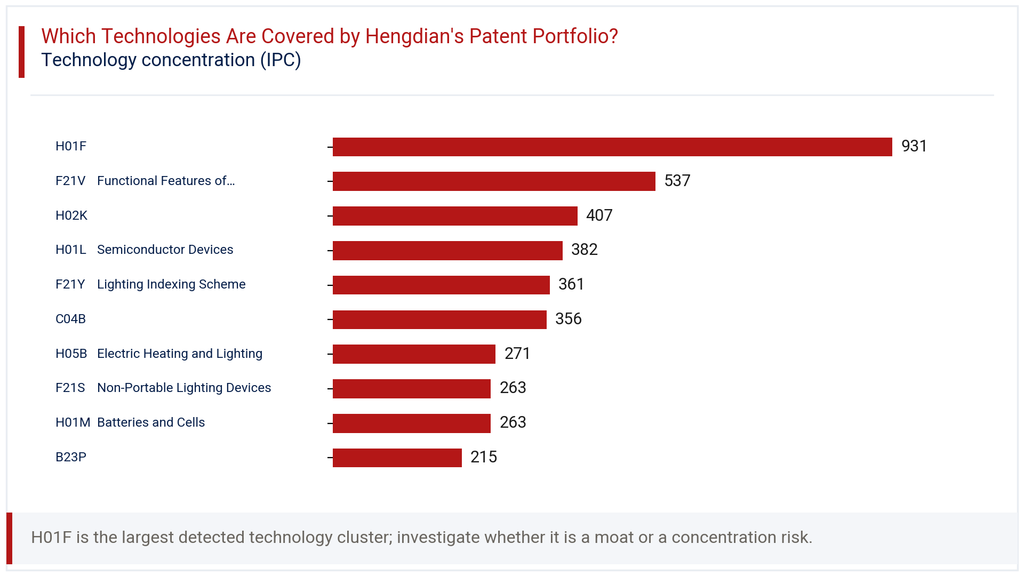
Lighting-related classes form the next major cluster, with F21V (functional features of lighting devices) at 13.5%, F21Y (lighting indexing scheme) at 9.1%, F21S (non-portable lighting devices) at 6.6%, and H05B (electric heating and lighting) at 6.8%. Together these lighting classes reflect the TOSPO Lighting subsidiary’s substantial research investment. H02K (electric machines) contributes 10.2%, while H01L (semiconductor devices) adds 9.6%. Smaller but meaningful shares appear in C04B (ceramics and cement, 8.9%), H01M (batteries and cells, 6.6%), and B23P (machine parts, 5.4%). This spread confirms a portfolio built around electrical components and lighting rather than a single narrow technology bet.
How Has the Hengdian Patent Portfolio Evolved Across Filing Geographies?
The heatmap tracking filings by year and jurisdiction shows China as the constant driver of volume throughout the portfolio’s history. Chinese filings rose from 280 in 2016 to a high of 664 in 2020, before settling in the 480 to 500 range through 2023 and 2024. International filing activity, by contrast, shows a much shorter and more concentrated window of activity.
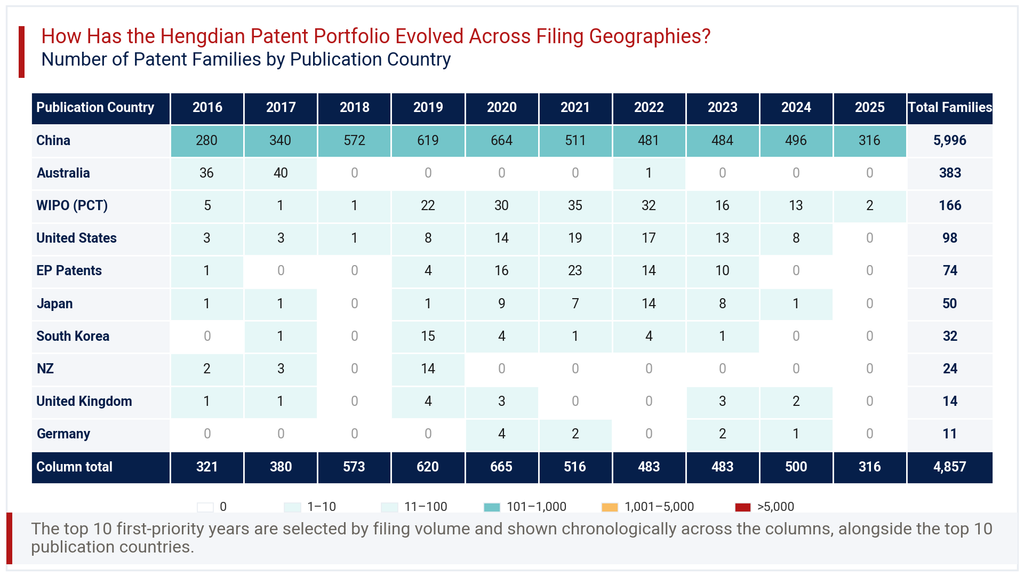
WIPO PCT filings appeared sporadically before 2019, then rose to 30 and 35 in 2020 and 2021 respectively, before tapering off again. United States filings followed a similar arc, climbing from single digits to 19 in 2021 before declining. European Patent filings peaked at 23 in 2021 and disappeared entirely by 2024. This pattern across the Hengdian Patent Portfolio suggests a window of international expansion roughly between 2019 and 2022, coinciding with the broader domestic filing peak, followed by a pullback to a more China-centric filing posture in recent years.
Consultant’s Perspective on Hengdian Patent Portfolio
From an advisory standpoint, the Hengdian Patent Portfolio reflects a conglomerate protecting its core industrial capabilities rather than chasing broad global exclusivity. The 23.4% concentration in magnetics technology (H01F) and the sizeable lighting cluster both map directly onto named subsidiaries, which is a healthy sign of filings tied to actual business units. A grant rate of 43.5% alongside an active rate of 56.1% suggests reasonably disciplined prosecution, though the 22.0% lapsed share warrants monitoring.
The near-total reliance on China (93.7%) is the most important structural feature here. It works well for a domestically oriented manufacturing base but leaves limited patent cover in markets where Hengdian’s subsidiaries, particularly DMEGC and TOSPO, already compete commercially. Given the group’s stated footprint across over 150 countries, the gap between commercial reach and international patent protection is notable. Companies evaluating partnership, licensing, or competitive positioning against Hengdian should watch whether international filing activity, particularly PCT and EP applications, resumes beyond the 2019 to 2022 window. A revival there would signal renewed global ambition; continued concentration in China would confirm a deliberately domestic protection strategy.
Explore Deeper Insights with Expertlancing Research
This overview only scratches the surface of what the Hengdian Patent Portfolio can reveal about competitive positioning and technology direction. Expertlancing Research helps clients go deeper, mapping specific patent families, assessing claim strength, and benchmarking against competitors in magnetics, lighting, and related fields. Whether you are evaluating a licensing opportunity, conducting freedom-to-operate research, or tracking a competitor’s filing behavior, our analysts can tailor the research to your decision. Reach out to discuss how a focused study could support your next strategic move.