

The Hengtong Patent Portfolio offers a useful window into how one of China’s largest cable manufacturers protects its engineering work. Across 17,642 total patent families, the portfolio shows an active rate of 46.2%, a figure covering both granted and pending cases together. Of these, 7,012 families stand granted and 1,143 remain pending, translating into a grant rate of 39.7%. Meanwhile, 9,487 families fall into lapsed, revoked, or expired status combined. These are prosecution and maintenance metrics, not a verdict on patent quality or enforceability.
Filing activity peaked in 2020, when Hengtong filed 1,626 patent families, the highest single-year count in this dataset. China dominates the filing geography, accounting for 99.7% of all filings, spread across 10 jurisdictions in total. On the technology side, H01B (cables, conductors, and insulators) leads the portfolio with 2,334 families, making it the single largest technology cluster Hengtong has built around.
This report works through what these filing patterns suggest about Hengtong’s research priorities and geographic focus. Filing counts alone do not establish product success, market dominance, or competitive advantage in any given technology. Readers evaluating specific patent families for licensing, litigation, or investment purposes should verify details directly against primary patent office records. What follows is a structured read of the numbers, not a substitute for that due diligence.
About Hengtong
Company Profile: Hengtong is China’s largest power and fiber optic cable manufacturer. Hengtong Group is China’s largest power and fiber optic cable manufacturer. The company reports it specializes in fiber optic communication, power transmission, EPC turnkey services, IoT, big data, and new energy. Hengtong Group is a leading international enterprise specializing in fiber optic communication, power transmission, EPC turnkey services, IoT, big data, e-commerce, new materials, and new energy.
The company describes itself as the world’s second largest cable manufacturer, with operations spanning over 150 countries. The company has 12 overseas factories, with products and services covering more than 150 countries. The company was founded in 1991 and in 2003 was listed on the Shanghai Stock Exchange. It was listed as the 7th largest manufacturer in Integer’s 2017 Top 100 Global Wire & Cable Producers, the only Chinese cable manufacturer to make the ranking’s top 10.
Hengtong has expanded into property, energy, and financial securities businesses as well.
How Healthy is Hengtong Patent Portfolio?
Patent portfolio health depends on how filings move through their legal lifecycle, and Hengtong’s numbers tell a mixed story. Granted patents make up 39.7% of the portfolio, while pending applications sit at 6.5%. On the other side, lapsed families account for 38.0%, revoked for 11.4%, and expired for 4.4%. The composition chart in this section shows these shares side by side, and the lapsed and revoked totals together exceed the granted share, which is worth watching closely.
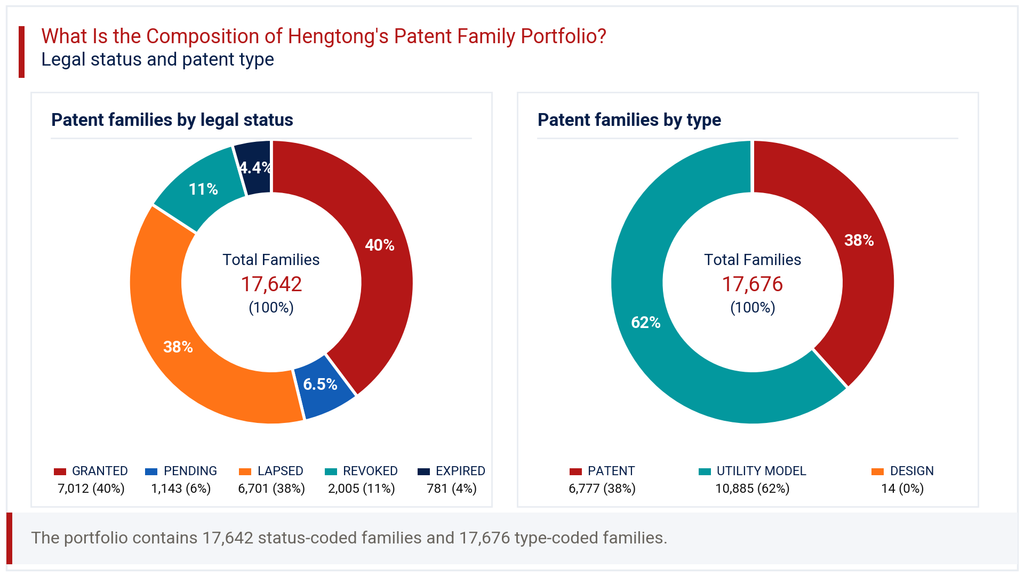
Patent type adds another layer to this picture. Utility models dominate at 61.6% of the portfolio, compared to 38.3% for standard patents and just 0.1% for design rights. This heavy utility model tilt is typical for Chinese manufacturers, since utility models face lighter examination and faster grant timelines than invention patents. It suggests Hengtong prioritizes speed and breadth of filing over the deeper substantive review that invention patents require. For a reader assessing patent portfolio health, this mix points to a strategy built around incremental engineering improvements, protected quickly and in volume, rather than a smaller set of heavily litigated core inventions.
How Has the Hengtong Patent Portfolio Evolved Over Time?
Patent filing trends at Hengtong show a long climb followed by a recent pullback. Filings rose from just 108 in 2008 to a peak of 1,626 families in 2020. The years between 2015 and 2023 stayed consistently high, generally above 1,000 filings annually, which signals sustained R&D investment through that period. The filing-trend chart in this section captures this full arc clearly.
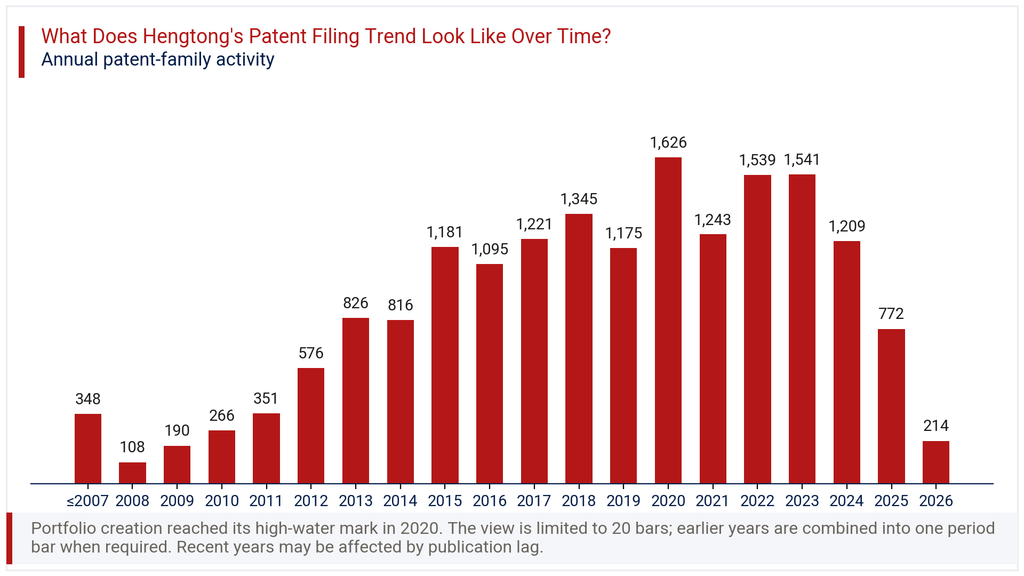
The two most recent years need careful reading. Filings dropped to 772 in 2025 and 214 in 2026, with the latest year showing a change of -72.3%. This is not necessarily a genuine collapse in R&D activity. Patent applications typically take 12 to 18 months to appear in public databases after filing, so recent years are almost always undercounted at the time any dataset is pulled. The more reliable signal sits in the 2017 to 2023 window, where filing volumes stayed strong and consistent, reflecting an active and mature filing programme rather than a business in decline.
Where Does the Hengtong Patent Portfolio Prioritize Patent Protection?
Patent geography for Hengtong is heavily domestic. China accounts for 99.7% of all filings, a concentration level that leaves very little international footprint by comparison. The remaining 10 jurisdictions, including the United States, Japan, Germany, and India, each hold a small fraction of total filings, with WIPO PCT filings at 1.3% representing the largest non-Chinese channel. The geographic chart in this section makes this imbalance immediately visible.
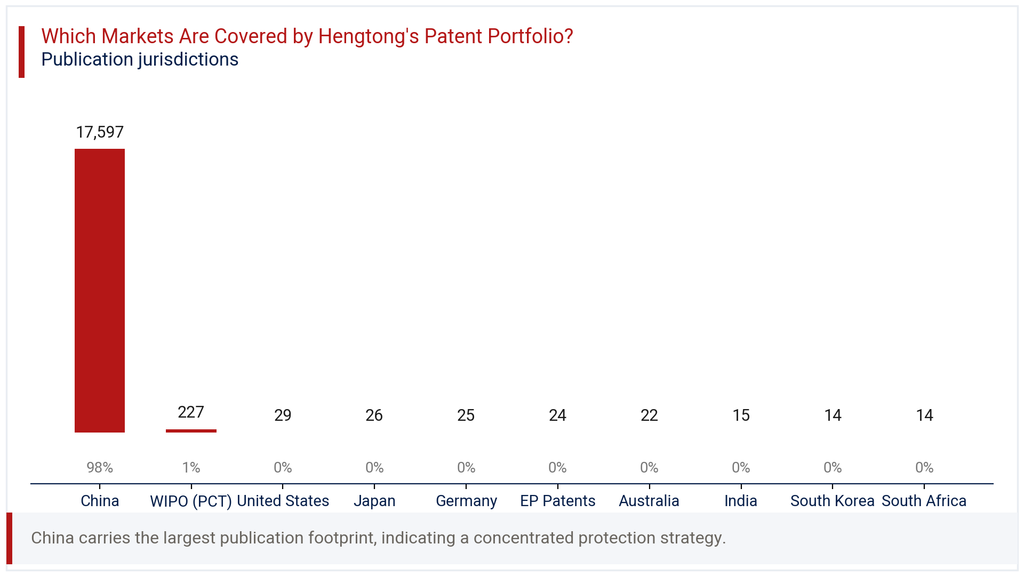
This pattern is common among Chinese infrastructure and materials manufacturers whose primary markets and manufacturing base sit within China itself. It does not necessarily mean Hengtong lacks global ambition, given its stated presence across more than 150 countries through its overseas factories. It does mean that patent protection outside China is thin, which has real implications for any competitor or partner assessing freedom to operate in markets like the United States or the European Union. Businesses relying on Hengtong technology outside China should treat the absence of dense patent coverage there as a gap worth independent verification, not an oversight.
Where is the Hengtong Patent Portfolio Building Protection Across Key Technologies?
IPC analysis of the Hengtong portfolio points clearly toward cable and optical technology as the core of its R&D effort. H01B, covering cables, conductors, and insulators, leads with 2,334 families and 31.1% share. Close behind sits G02B, optical elements and instruments, at 1,942 families and 25.9% share. Together these two classes account for more than half the entire portfolio, which aligns tightly with Hengtong’s stated focus on power and fiber optic cable manufacturing.
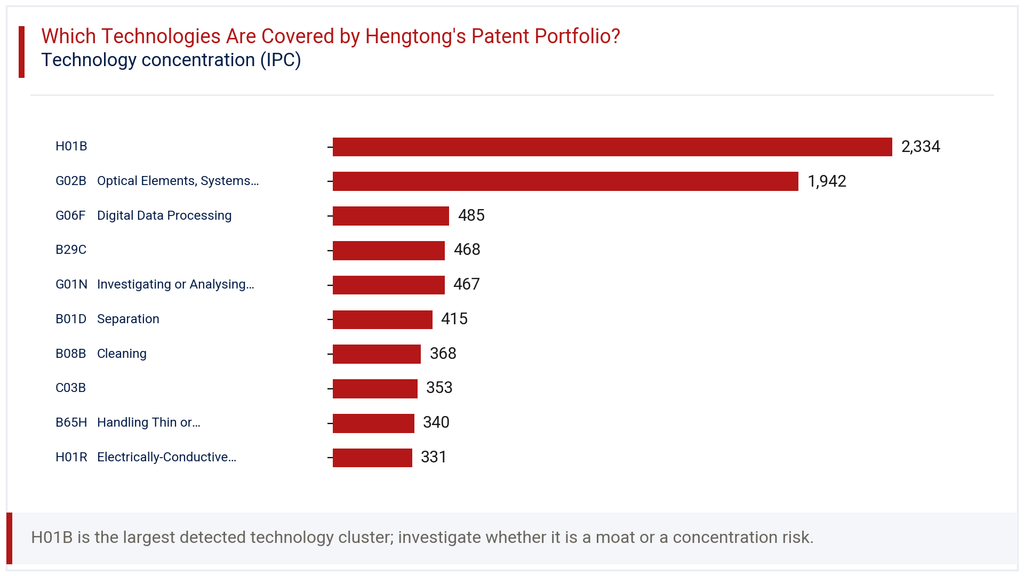
Beyond these two leaders, the technology chart in this section shows a long tail of smaller clusters. G06F (digital data processing) holds 485 families, B29C (shaping or joining plastics) holds 468, and G01N (materials investigation and analysis) holds 467. Classes like B01D (separation), B08B (cleaning), C03B (glass manufacturing), and H01R (electrical connections) each contribute smaller single-digit percentage shares. This spread suggests Hengtong is extending patent protection from its core cable business into adjacent manufacturing processes, materials science, and data systems, likely supporting its broader push into IoT and big data services.
How Has the Hengtong Patent Portfolio Evolved Across Filing Geographies?
Looking at filings by year and jurisdiction together sharpens the picture painted earlier. China’s filing volume tracks almost exactly with the portfolio’s overall trend, rising from 1,180 in 2015 to a peak of 1,616 in 2020, before settling around 1,200 to 1,500 through subsequent years. The heatmap in this section shows this dominant column running consistently dark across the entire timeframe.
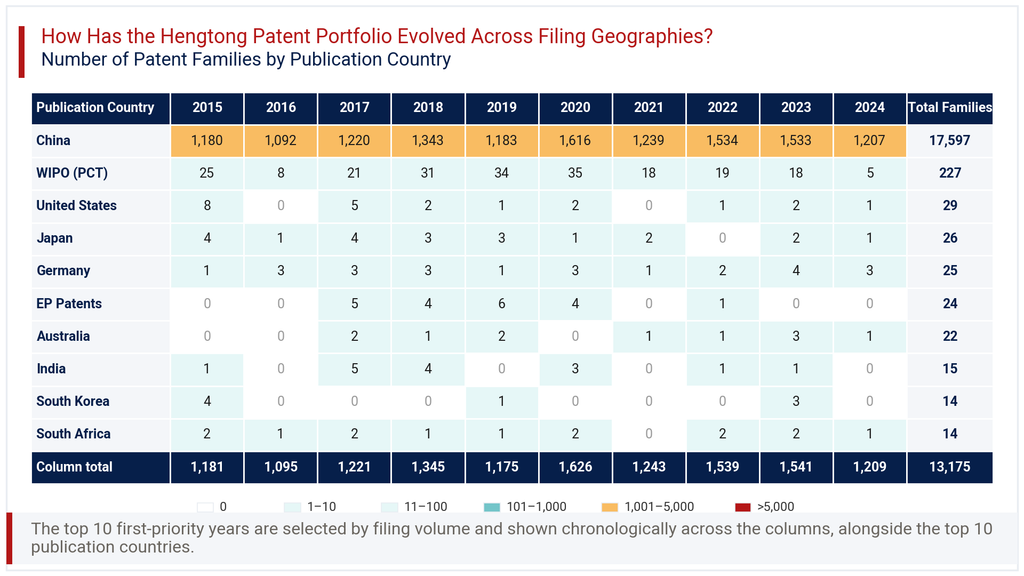
International filings tell a thinner, more sporadic story. WIPO PCT filings ranged between 5 and 35 per year, peaking in 2020 alongside the domestic surge. The United States, Japan, Germany, and other jurisdictions each show single-digit annual counts, with several years recording zero filings in a given country. Germany stands out slightly for consistency, with filings most years between 1 and 4. This pattern confirms that Hengtong’s international filing activity moves in step with, but at a much smaller scale than, its domestic programme, rather than following an independent international strategy.
Consultant’s Perspective on Hengtong Patent Portfolio
Reading the Hengtong Patent Portfolio as a whole, the dominant story is one of scale concentrated almost entirely within China. With 17,642 total families and 99.7% of filings domestic, Hengtong has built a dense protective layer around its home market and core cable technologies. The heavy tilt toward utility models, at 61.6% of the portfolio, reinforces an approach built around speed and volume rather than depth of examination.
The technology concentration in H01B and G02B, together over half the portfolio, confirms a tightly focused R&D identity around cable and optical systems. What stands out as a genuine signal to monitor is the thin international presence, given the company’s stated operations across 150-plus countries. That gap between commercial reach and patent protection abroad deserves closer scrutiny from any party assessing competitive risk or partnership terms with Hengtong.
Going by the evidence, Hengtong’s near-term priority should be strengthening international filings, particularly in markets where its overseas factories operate. For competitors and investors, the portfolio data signals a company confident domestically but potentially exposed on foreign intellectual property protection. That asymmetry is the one factor worth tracking most closely over the next few years.
Explore Deeper Insights with Expertlancing Research
This overview of the Hengtong Patent Portfolio only scratches the surface of what the underlying filing data can reveal. Expertlancing Research helps businesses go deeper, mapping specific patent families, assessing freedom-to-operate risk, and benchmarking competitors across technology clusters. Whether you are evaluating a partnership, tracking a competitor, or scoping an investment, our analysts can build a tailored intelligence report around your specific questions. Reach out to Expertlancing Research to commission a detailed study suited to your business decision.