


The Hisense Patent Portfolio spans 46,411 patent families, offering a useful lens into how this Chinese electronics major builds and defends its technology base. Of this total, 68.9% remain active, a figure that combines both granted and pending families still under legal effect. Within the portfolio, 24,045 families have reached grant, while 7,944 sit in pending status awaiting examination outcomes. The grant rate stands at 51.8%, and a combined 14,422 families fall into lapsed, revoked, or expired categories. These figures describe prosecution and maintenance status only, not a judgment on patent quality or enforceability.
Filing activity peaked in 2022, when Hisense recorded 5,514 new families, marking the busiest year in the dataset. China dominates the jurisdictional spread, accounting for 97.5% of all filings, with the portfolio spread across 10 jurisdictions tracked. The leading technology cluster is F24F, covering Air-Conditioning and Air-Humidification technologies, with 10,157 families, well ahead of every other classification. This concentration points to a company whose patenting behaviour is closely tied to home appliance and climate-control engineering.
This report draws on structured patent filing records to describe scale, timing, geography, and technology focus at a portfolio level. Filing volume alone does not confirm commercial success, product adoption, or competitive superiority over rival filers. Readers considering business or investment decisions should verify specific patent families before relying on them externally. The analysis that follows is meant to orient, not substitute for, deeper legal and technical due diligence.
About Hisense
Company Profile: Hisense Group Co., Ltd. is a major appliance and electronics manufacturer headquartered in Qingdao, Shandong, China . Television sets are one of its principal products . In the first quarter of 2026, Hisense accounted for 13% of global television shipments, behind Samsung and TCL, according to Counterpoint Research . Hisense also operates as an original equipment manufacturer, producing some goods sold under brands other than Hisense .
Two major subsidiaries of Hisense Group are publicly listed: Hisense Visual Technology and Hisense Home Appliances Group . The company’s predecessor, Qingdao No. 2 Radio Factory, was founded in September 1969, and it became Hisense in March 1993 . According to the company, Hisense began in 1969 as a manufacturer of radios in Qingdao, China, and started manufacturing TVs ten years later .
Hisense acquired Toshiba’s TV business in 2018 and became an official sponsor of FIFA World Cup 2026 . The company reports a global presence with offices and factories worldwide.
How Healthy is Hisense Patent Portfolio?
Patent portfolio health for Hisense looks reasonably solid on paper, with an active rate of 68.9% across granted and pending families. The legal status composition chart shows 51.8% of families granted, 17.1% still pending, and the remainder split across 14.5% lapsed, 13.1% revoked, and 3.4% expired. A grant rate above half suggests the company’s filings generally clear examination standards in its primary markets, most notably China.
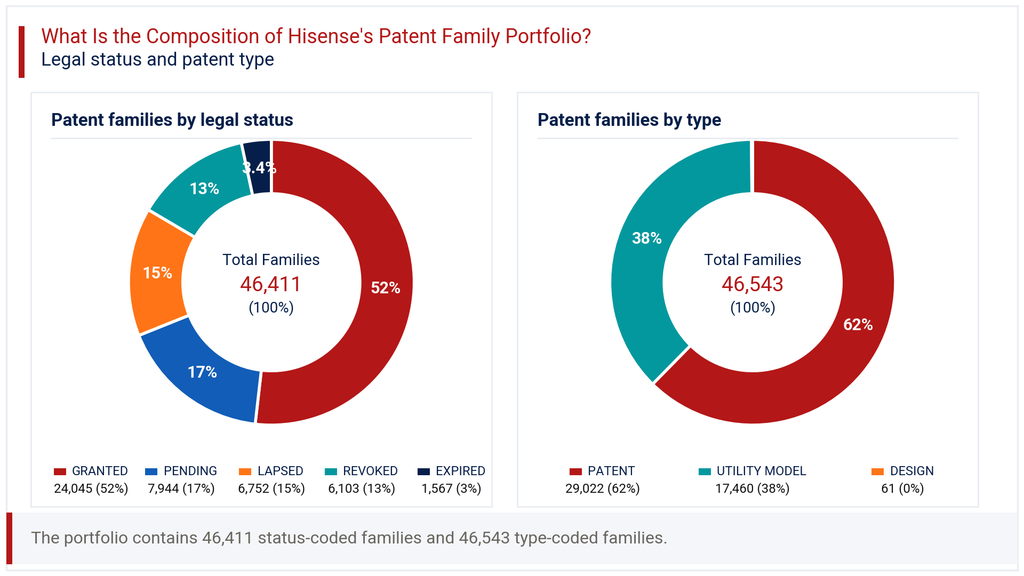
Patent type distribution adds further texture. Traditional patents make up 62.4% of the portfolio, utility models account for 37.5%, and design filings are a marginal 0.1%. This heavy reliance on utility models, alongside full patents, reflects a filing strategy common among Chinese manufacturers, who often use utility models for faster, lower-cost protection of incremental engineering improvements. The relatively high combined lapsed and revoked share, together above 27%, indicates a portion of older filings have exited active protection through natural expiry or non-renewal. This is typical for large, mature portfolios rather than a sign of weakness, though it does warrant periodic review of which families still carry commercial relevance.
How Has the Hisense Patent Portfolio Evolved Over Time?
Patent filing trends at Hisense show a long climb followed by a sharp recent pullback. Annual filings grew from under a thousand in the late 2000s to 2,395 by 2016, then accelerated further through the following years. The filing-trend chart shows a clear surge beginning 2019, with 2,583 families, rising to 4,811 in 2020 and peaking at 5,514 in 2022.
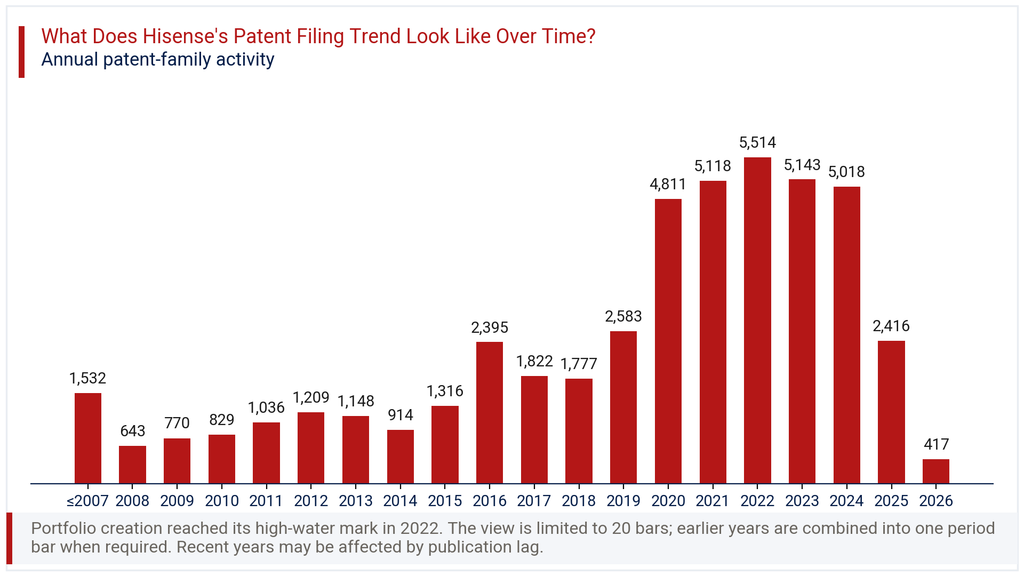
Filings held near peak levels through 2023 at 5,143 and 2024 at 5,018, before dropping to 2,416 in 2025 and just 417 in 2026. The dataset records a latest_year_change_pct of -82.7%, a steep fall that should be read cautiously. Recent filing years typically understate true activity because patent applications take time to publish and appear in searchable records. Rather than signalling a retreat from innovation spending, this dip most likely reflects publication lag inherent to patent data systems. The underlying pattern from 2019 through 2024 points to a sustained, multi-year expansion phase for Hisense’s filing activity, concentrated heavily around appliance and display technologies.
Where Does the Hisense Patent Portfolio Prioritize Patent Protection?
Patent geography for Hisense is overwhelmingly domestic. The geographic chart shows China holding 97.5% of all filed families, a dominant share that dwarfs every other jurisdiction. WIPO’s PCT route follows at a modest 5.7%, used selectively to preserve international filing options rather than as a primary protection channel.
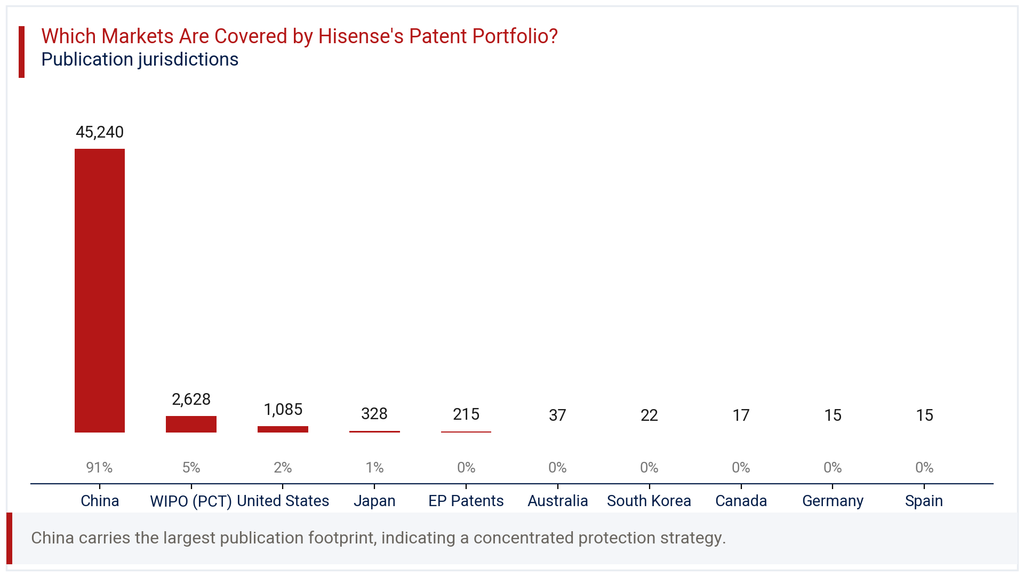
The United States holds 2.3% of filings, with Japan at 0.7% and European Patents at 0.5%. Australia, South Korea, Canada, Germany, and Spain each register under 0.1%, reflecting narrow, selective filing rather than broad international coverage. This pattern suggests Hisense treats China as its core defensive and commercial territory, while international filings serve specific market entry or licensing needs. For competitors or partners assessing where Hisense might assert rights, the practical exposure outside China remains limited today. Companies operating in the US, Japan, or Europe should still track these smaller filings closely, since they often cover technologies Hisense considers commercially important enough to protect abroad.
Where is the Hisense Patent Portfolio Building Protection Across Key Technologies?
The technology chart in this section highlights a portfolio anchored in home appliance engineering. F24F, covering air-conditioning and air-humidification systems, leads with 10,157 families, representing 26.3% of all classified filings. This is followed by H04N, image and video processing and display technology, at 6,532 families or 16.9%.
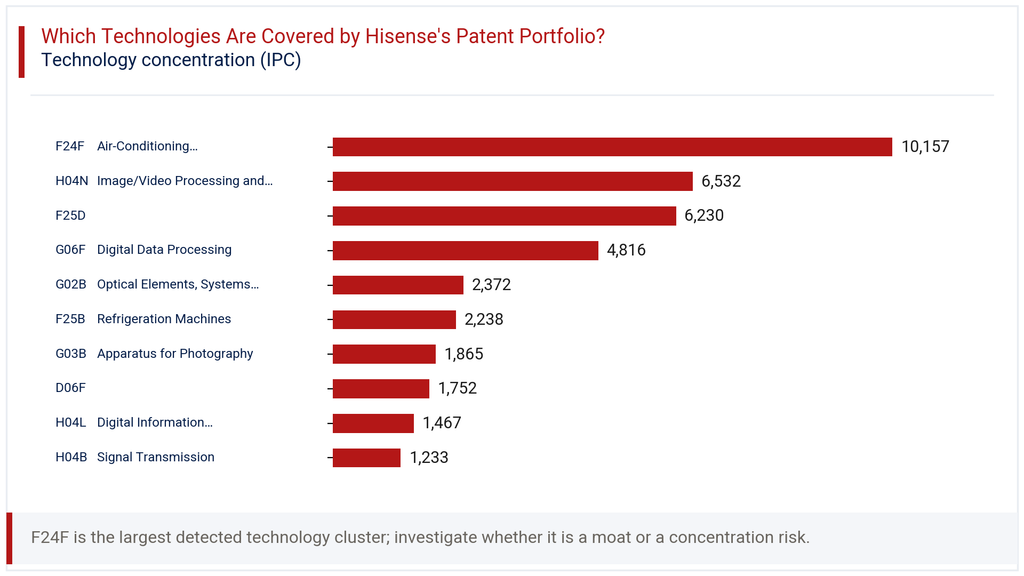
Refrigeration-adjacent classes also rank highly, with F25D contributing 6,230 families at 16.1%, and F25B, refrigeration machines, adding 2,238 families at 5.8%. Digital data processing under G06F holds 12.5% with 4,816 families, reflecting growing investment in software and computing capability alongside hardware. Optical elements and photography apparatus, under G02B and G03B, together contribute meaningful shares as well. This IPC analysis shows Hisense balancing its traditional appliance strength in cooling and climate control with steady investment in display and digital processing technology. The spread across these clusters indicates a company whose research spans physical hardware and the software or imaging layers that increasingly define modern consumer electronics products.
How Has the Hisense Patent Portfolio Evolved Across Filing Geographies?
The heatmap view of filings by year and jurisdiction reinforces how tightly Hisense’s growth has tracked its home market. China’s filings rose from 2,341 in 2016 to a peak of 5,434 in 2022, closely mirroring the overall portfolio trend. Other jurisdictions moved at much smaller scale throughout this period.
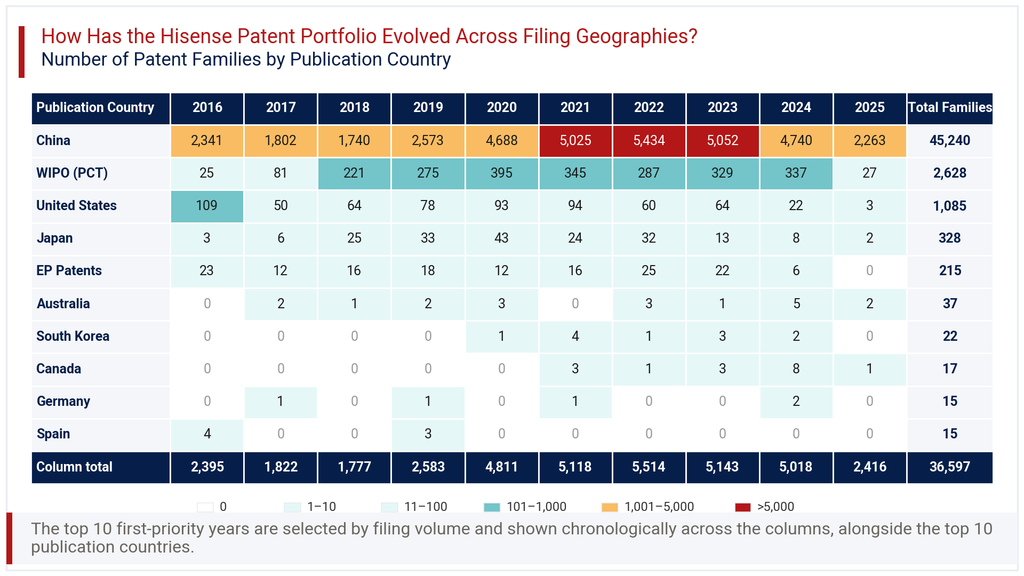
WIPO filings grew from just 25 in 2016 to a high of 395 in 2020, before settling between 287 and 337 annually through 2024. United States filings peaked at 109 in 2016 and have since trended lower, reaching only 22 in 2024. Japan, EP Patents, and other jurisdictions show similarly modest, fluctuating counts, none exceeding a few dozen families per year. This pattern confirms that Hisense’s international filing behaviour has stayed fairly stable and conservative, even as its domestic Chinese filings surged. The company appears to treat overseas patent filing as a targeted supplement, rather than scaling it in proportion to domestic growth.
Consultant’s Perspective on Hisense Patent Portfolio
Viewed as a whole, the Hisense Patent Portfolio reflects a company whose innovation investment is deeply rooted in its home market. The scale of Chinese filings, combined with a healthy 51.8% grant rate, points to a disciplined and well-resourced domestic filing program. What stands out is the gap between this domestic intensity and the comparatively thin international footprint, particularly in the United States and Europe.
For competitors and partners, this suggests Hisense’s near-term patent risk and opportunity sit primarily within China, especially in air-conditioning, refrigeration, and display technology. Businesses evaluating licensing deals, supply partnerships, or competitive threats should pay closer attention to the smaller but strategically selected international filings, since these likely mark technologies Hisense considers globally relevant. The recent filing dip in 2025 and 2026 should not be mistaken for reduced research activity, given known publication delays.
My recommendation for any business tracking this space is to monitor Hisense’s PCT filings closely, as these often predict where the company plans eventual commercial or litigation activity outside China. Combining that signal with technology cluster trends, particularly in digital processing and imaging, offers a more complete read on where Hisense intends to compete next.
Explore Deeper Insights with Expertlancing Research
Understanding a patent portfolio at this scale requires more than summary statistics. Expertlancing Research helps businesses go deeper, validating specific patent families, assessing competitive overlap, and building custom intelligence around filing strategy and technology direction. If you are evaluating Hisense as a competitor, partner, or licensing target, our team can build a tailored analysis around your specific business question. Reach out to Expertlancing Research to turn these patterns into decisions you can act on with confidence.