


The Hua Hong Patent Portfolio spans 3,091 patent families, with 55.7% of these still active across granted and pending stages. Of this total, 1,392 families stand granted, while 331 remain pending before patent offices worldwide. The grant rate sits at 45.0%, a figure that reflects how much of the filed work has cleared examination. Together, lapsed, revoked, and expired families account for 1,368 cases, a meaningful share of the overall count. These numbers describe prosecution and maintenance outcomes only, not a verdict on patent quality or enforceability.
Filing activity peaked in the years before 2007, with 848 families recorded in that combined early period, the single largest block in the portfolio’s history. China dominates the jurisdictional footprint, holding 95.7% share across a total of 10 jurisdictions where Hua Hong has sought protection. The leading technology cluster is H01L Semiconductor Devices, carrying 1,544 families, by far the most concentrated area of invention. This concentration tells a story of a company anchored firmly in its home market and core discipline.
This report reads the Hua Hong Patent Portfolio as a lens into filing behaviour, not as a scorecard of commercial outcomes. Counting patent families reveals where a company places its bets, but it does not confirm market success or competitive strength on its own. Readers using this analysis for diligence, benchmarking, or investment screening should treat it as a starting point. Individual families warranting deeper scrutiny should be verified directly against patent office records before being cited externally.
About Hua Hong
Company Profile: Hua Hong Semiconductor Limited is a publicly listed Chinese pure-play semiconductor foundry company based in Shanghai, established in 1996 as part of China’s national efforts to boost its IC industry. The company began as a joint venture producing DRAM before pivoting its business model. In 1997, a joint venture HHNEC was formed between Huahong and NEC China to produce DRAM for NEC, and the company phased out DRAM production in 2003 and became a pure-play foundry.
Its core offerings today include embedded non-volatile memory, power discrete devices, analog and power management, and logic and RF process platforms, serving fabless chip companies globally. Its most advanced node is achieved through subsidiary Shanghai Huali, which can manufacture 28/22-nm process technology. The company is currently mainland China’s second largest chip-maker behind rival SMIC and ranks sixth largest globally, with a market share of 2.6% in 2021.
Revenue stood at US$1.63 billion in 2021, with net income of US$182 million that year.
How Healthy is Hua Hong Patent Portfolio?
Patent portfolio health depends on how filings move through their lifecycle, and the numbers here show a mixed picture. Granted families make up 45.0% of the total, against 10.7% still pending examination. Lapsed families account for 33.6%, while revoked and expired cases add 7.3% and 3.3% respectively. The composition chart in this section shows these proportions clearly, and the lapsed share stands out as sizeable. A portfolio with a third of its families lapsed suggests selective maintenance rather than blanket renewal across the board.
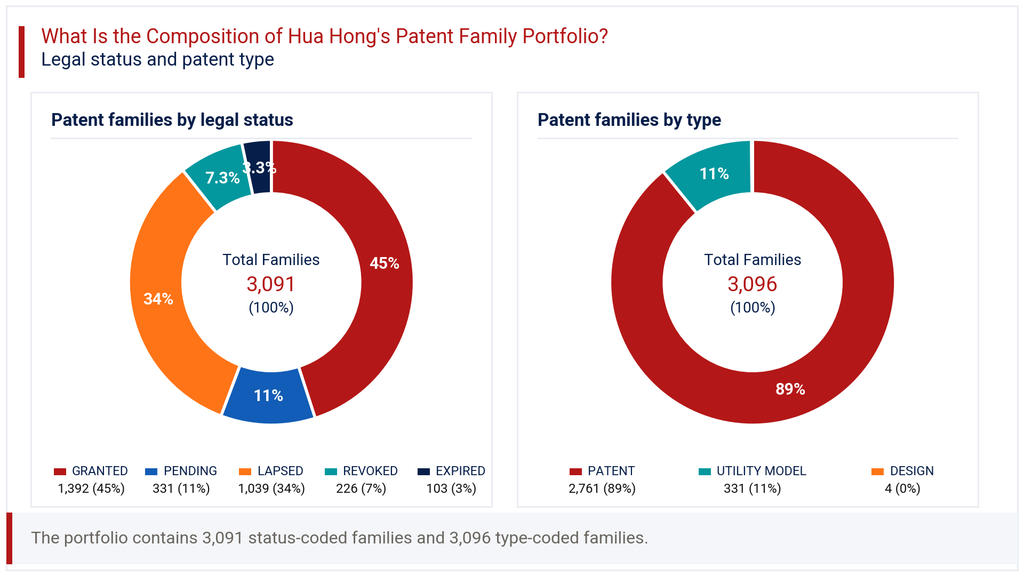
Patent type data adds further texture. Standard patents represent 89.2% of filings, utility models 10.7%, and design filings a negligible 0.1%. This heavy tilt toward full patents, rather than utility models, points to inventions considered substantial enough to justify the longer and costlier examination route. The active rate of 55.7% combines granted and pending families, giving a fair read of what remains enforceable or in process today. For a company operating in a capital-intensive foundry business, this level of active protection looks proportionate to its scale, though the lapsed share deserves monitoring by anyone assessing long-term portfolio strength.
How Has the Hua Hong Patent Portfolio Evolved Over Time?
Patent filing trends across Hua Hong’s history show a distinct two-phase pattern. The period up to 2007 carries 848 families, the heaviest concentration in the dataset, followed by strong activity in 2009 (304), 2010 (366), and 2011 (493). Filing then dropped sharply from 2013 onward, with annual counts in the low double digits through much of the following decade. The filing-trend chart in this section captures this decline and the later recovery that follows it.
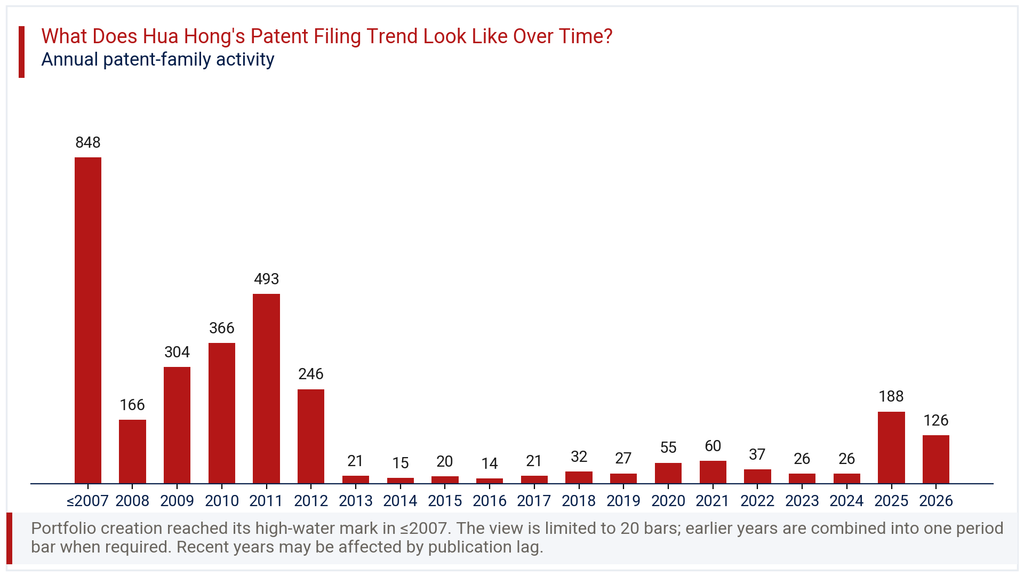
Activity picks up again noticeably by 2020 and 2021, with 55 and 60 families respectively, before a renewed surge appears in 2025 at 188 families. The 2026 figure of 126 continues this upward movement, though the latest_year_change_pct of -33.0% signals a slowdown worth watching. Recent-year counts, particularly for 2025 and 2026, likely understate true filing activity due to publication lag inherent in patent data. Readers should treat the most recent one to two years as provisional rather than as confirmed evidence of a pullback in research investment.
Where Does the Hua Hong Patent Portfolio Prioritize Patent Protection?
Patent geography for Hua Hong leans overwhelmingly toward its home jurisdiction. China accounts for 95.7% of all filings, equivalent to 2,959 families, dwarfing every other location. The United States follows at 7.8% with 240 families, and WIPO PCT filings represent 2.7%, pointing to some appetite for international routing. Taiwan, EP Patents, Japan, Canada, South Korea, Australia, and Israel round out the remaining jurisdictions, each holding a share below 3%.
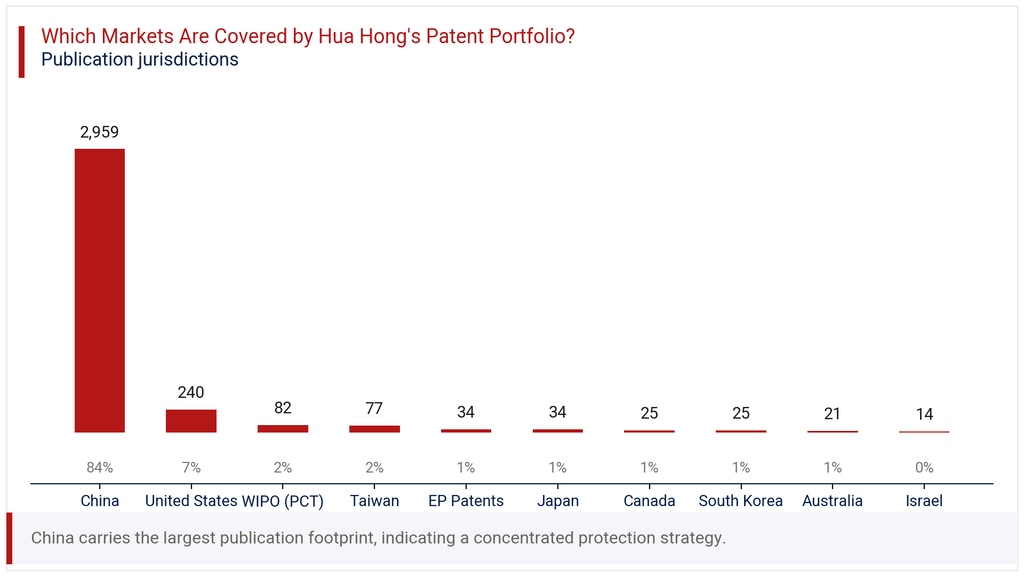
The geographic chart in this section makes the scale of this imbalance immediately visible. Filing across 10 distinct jurisdictions shows some international awareness, but the volumes outside China remain modest. This pattern aligns with Hua Hong’s position as a foundry serving global fabless clients from a China-based manufacturing base. For businesses assessing freedom to operate or licensing opportunities abroad, the thin coverage outside China and the United States is a detail that merits closer examination before any cross-border commercial decision.
Where is the Hua Hong Patent Portfolio Building Protection Across Key Technologies?
IPC analysis of the Hua Hong Patent Portfolio points to a clear technical centre of gravity. H01L Semiconductor Devices leads with 1,544 families, representing 51.3% of the entire portfolio, more than every other category combined. H10P Bulk Acoustic Wave Devices follows at 11.6% with 349 families, then G03F Photomechanical Production of Patterns at 6.3%. H10W Wide-Bandgap Semiconductor Devices holds 6.2%, and H10D Semiconductor and Solid-State Devices sits at 5.7%.
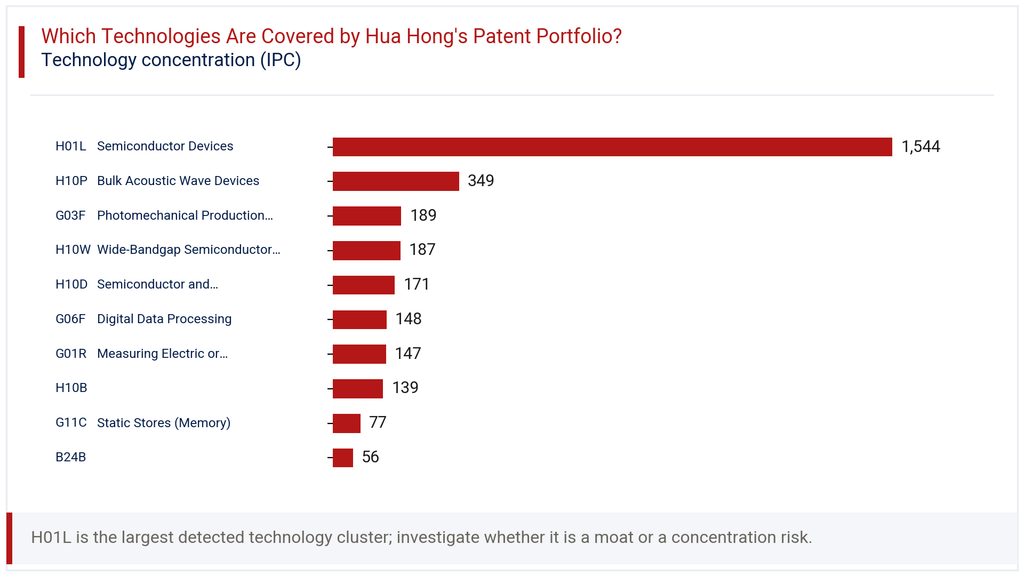
The technology chart in this section lays out this distribution across ten identified classes. Smaller but notable clusters include G06F Digital Data Processing at 4.9%, G01R Measuring Electric or Magnetic Variables also at 4.9%, and H10B at 4.6%. This spread shows Hua Hong concentrating heavily on core semiconductor device structures while maintaining secondary interests in measurement, memory, and digital processing. The dominance of H01L signals that fabrication-level device innovation, rather than downstream software or system design, remains the company’s central area of patent investment.
How Has the Hua Hong Patent Portfolio Evolved Across Filing Geographies?
Viewing filings by year and jurisdiction together reveals how closely Hua Hong’s international activity tracks its domestic filing cycles. China’s count rises steadily from 173 in 2005 to 482 in 2011, mirroring the broader portfolio peak already observed. The United States follows a similar but much smaller rising curve, moving from 2 filings in 2005 to 29 by 2011, before tapering off entirely by 2025 and 2026.
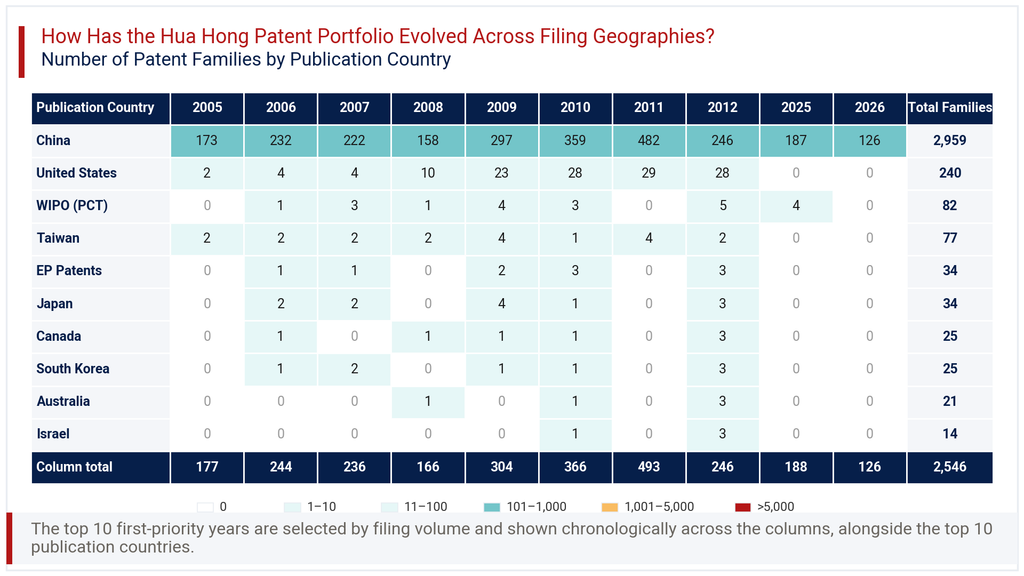
The heatmap in this section shows that smaller jurisdictions, including Taiwan, Japan, and South Korea, saw brief, low-volume activity concentrated mainly between 2006 and 2012. None of these secondary jurisdictions shows filings recorded for 2025 or 2026, while China alone continues with 187 and 126 families in those years. This pattern confirms that Hua Hong’s recent filing resurgence is a domestic phenomenon, not one accompanied by renewed international expansion. Anyone tracking the company’s global IP ambitions should note that recent growth has not yet translated into broader jurisdictional diversification.
Consultant’s Perspective on Hua Hong Patent Portfolio
The Hua Hong Patent Portfolio tells a story of a foundry business filing in close step with its own manufacturing roadmap. The early-2010s surge lines up with the company’s transition years after exiting DRAM, and the 2025 rebound likely reflects renewed investment around advanced process nodes. The 45.0% grant rate and 55.7% active rate suggest a portfolio that is functional but not maximally defended, given the 33.6% lapsed share sitting alongside it.
What stands out most is the geographic concentration. With 95.7% of filings in China, Hua Hong’s patent strategy still reads as domestically oriented, even as it competes for fabless clients worldwide. Competitors with broader international filing footprints may hold an edge in markets like the United States or Europe, where enforcement options matter more. The technology concentration around H01L, at over half the portfolio, confirms a company doubling down on core device fabrication rather than diversifying into adjacent digital or software domains.
Businesses evaluating Hua Hong for partnership, licensing, or competitive benchmarking should watch whether the 2025 and 2026 filing momentum extends into international jurisdictions. A portfolio this concentrated in one country carries both strength and exposure, depending on where a partner or competitor intends to operate.
Explore Deeper Insights with Expertlancing Research
This overview of the Hua Hong Patent Portfolio only scratches the surface of what structured patent intelligence can reveal. Expertlancing Research helps businesses go further, mapping specific families, assessing freedom to operate, and benchmarking competitors across technology and geography. Whether the goal is licensing due diligence, M&A screening, or R&D planning, our analysts can tailor a deeper study to the exact question at hand. Reach out to Expertlancing Research to commission a focused assessment built around your specific business decision.