


The Huadong Patent Portfolio spans 26,874 patent families, offering a window into how this company has built and defended its technology positions over nearly two decades. Of this total, 62.8% remains active, a figure that covers both granted patents and pending applications still under examination. The portfolio includes 13,214 granted patents and 3,651 pending applications, translating into a grant rate of 49.2%. The remaining families fall into lapsed, revoked, or expired status, together accounting for 10,009 families. These figures reflect prosecution and maintenance outcomes only, not a judgment on patent quality or enforceability.
Filing activity peaked in 2023, when the company filed 2,968 patent families, marking the highest single-year output in the dataset. China dominates the jurisdictional spread, holding 99.5% of all filings across a total of 10 jurisdictions covered by the portfolio. On the technology side, the leading cluster is E02D, a classification tied to foundation and ground engineering work, which accounts for 2,585 families, the single largest technology concentration in the entire portfolio.
This report draws on patent filing and legal status records to map how Huadong has positioned its innovation efforts over time. Filing volume alone does not confirm commercial success, product adoption, or competitive superiority in the market. Readers evaluating specific technology areas or individual families should validate those records independently before using them in external decisions. The analysis that follows is meant to guide informed questions, not to substitute for deeper legal and technical due diligence.
About Huadong
Company Profile: Huadong Medicine Co., Ltd., often called HD Medicine, is a Hangzhou based pharmaceutical company. It is registered on the Shenzhen Stock Exchange since December 1999. It is the largest pharmaceutical company in Zhejiang and the leading immunosuppressant manufacturer in China. It has a listed share capital of 380,000,000 RMB and a market capitalization of 5.1981 billion RMB as of June 2026. The company engages in antibiotics, Chinese patent medicines, synthetic drugs, and genetic engineering drug production, alongside wholesale distribution of medical apparatus.
Its product pipeline spans transplant immunity, endocrinology, cardiovascular and digestive system treatments. The company also pursues research in diabetes, oncology and autoimmune disease areas. In June 2025, the company received approval to commence clinical trials for Roflumilast Foam, targeting dermatological conditions. It maintains collaborations with external pharmaceutical partners on drug development programs. Huadong Medicine remains a significant player in China’s domestic pharmaceutical manufacturing sector.
How Healthy is Huadong Patent Portfolio?
Patent portfolio health depends heavily on legal status distribution, and the numbers here tell a layered story. Granted patents make up 49.2% of the total, while pending applications add another 13.6%, together supporting the 62.8% active rate cited earlier. Lapsed families account for 25.8%, with revoked and expired filings contributing 7.1% and 4.3% respectively. The composition chart in this section shows this spread clearly, highlighting that roughly a quarter of the portfolio has lapsed, often due to non-payment of renewal fees rather than legal challenge.
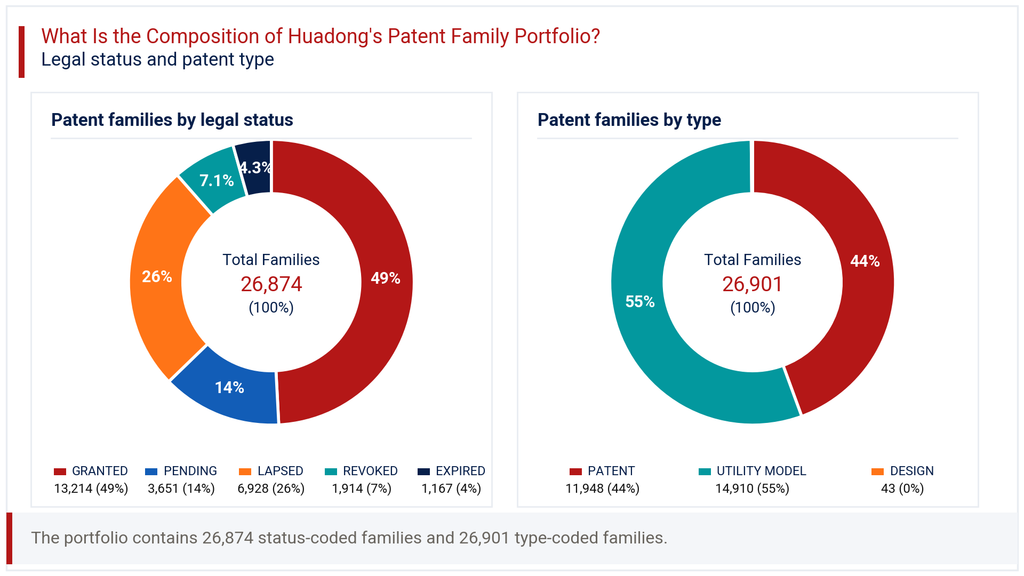
Patent type composition adds another dimension to this picture. Utility models account for 55.4% of filings, ahead of standard patents at 44.4%, with design filings forming a negligible 0.2%. This tilt toward utility models is common among Chinese filers, since utility models offer faster, lower-cost protection for incremental engineering improvements. It suggests Huadong favours practical, implementation-focused protection over broader invention claims in many of its filings. Taken together, the legal status and type data point to a portfolio that is substantial but requires closer scrutiny before weighing it against patents with full examination rigor.
How Has the Huadong Patent Portfolio Evolved Over Time?
Patent filing trends for Huadong show a long period of steady growth followed by a strong acceleration phase. Filings rose from under a thousand families before 2007 to 923 in 2014, then climbed further through the following decade. The filing-trend chart in this section shows a sharp rise beginning around 2019, when annual filings reached 1,747, continuing upward to 2,427 in 2022 and peaking at 2,968 in 2023.
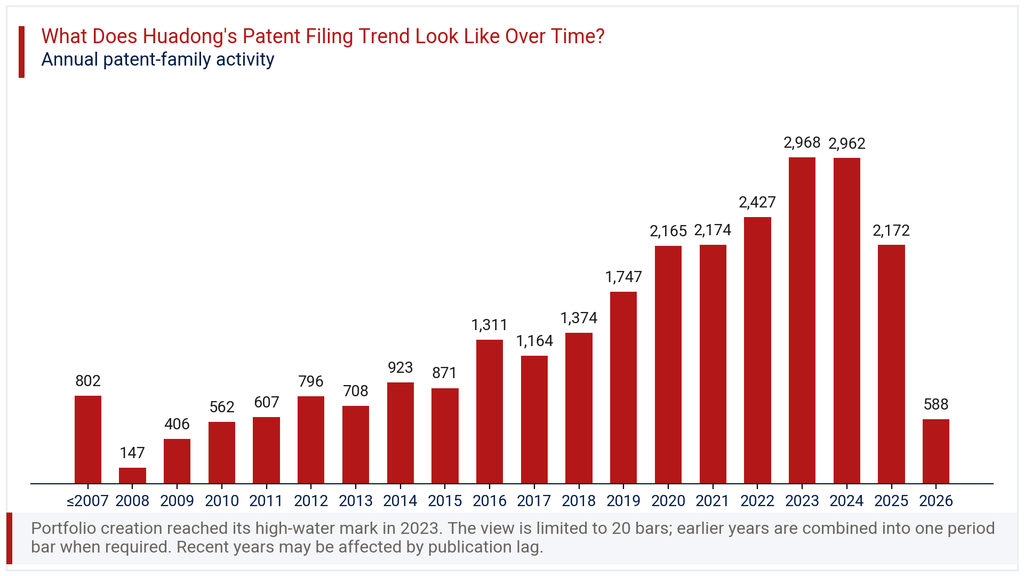
The two most recent years in the chart show a decline, with 2024 at 2,962 and 2025 dropping to 2,172, alongside a -72.9% change noted in the latest year on record. This drop should not be read as a genuine slowdown in innovation activity. Patent applications typically take many months, sometimes years, to appear in public databases after filing. The apparent fall in 2025 and the very low 2026 count of 588 most likely reflect publication lag rather than an actual pullback in research output. The broader decade-long trajectory still points to sustained, expanding investment in filing activity.
Where Does the Huadong Patent Portfolio Prioritize Patent Protection?
Patent geography for Huadong is overwhelmingly concentrated in its home market. China accounts for 99.5% of all filings, underscoring a domestic-first filing strategy. The geographic chart in this section shows every other jurisdiction trailing far behind, including WIPO PCT filings at 1.5% and the United States at 1.4%.
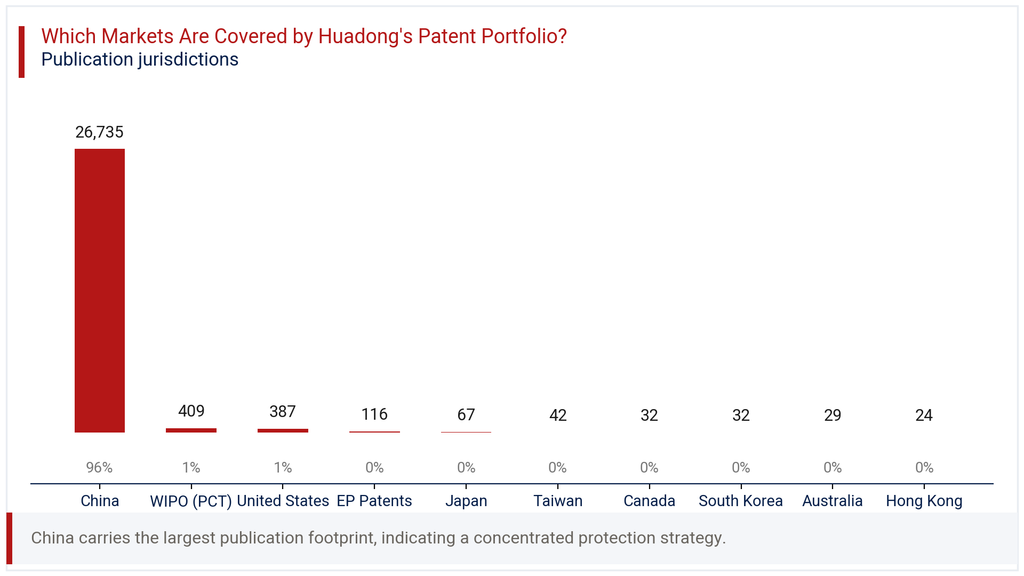
Other jurisdictions such as EP Patents, Japan, Taiwan, Canada, South Korea, Australia, and Hong Kong each represent 0.4% or less of total filings, rounding out a total spread across 10 jurisdictions. This pattern is typical for companies whose primary commercial activity and manufacturing base sit within China, where local protection carries the most immediate business value. It does suggest limited reliance on international patent protection as a growth lever outside China. For a pharmaceutical and engineering-adjacent filer, this concentration may reflect a deliberate choice to protect core markets first, with selective international filing reserved for specific high-value innovations rather than broad global coverage.
Where is the Huadong Patent Portfolio Building Protection Across Key Technologies?
IPC analysis of the Huadong portfolio reveals a strong tilt toward civil and structural engineering disciplines rather than pharmaceutical chemistry alone. The technology chart in this section shows E02D, covering foundation engineering, leading with 2,585 families and a 22.4% share. Close behind sits E02B, related to hydraulic engineering, at 2,149 families and 18.6% of the total.
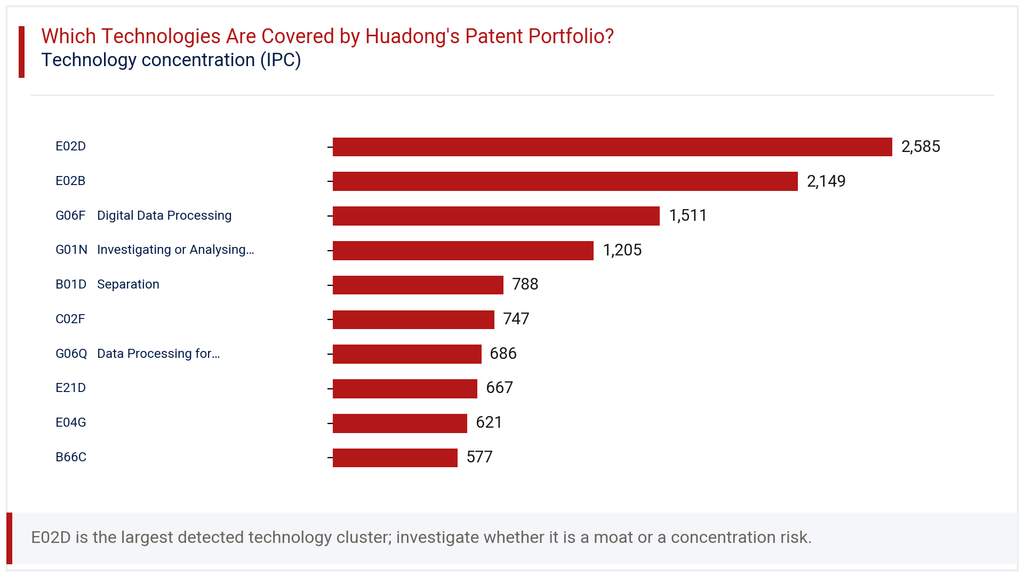
Digital technology also features meaningfully, with G06F, covering digital data processing, contributing 1,511 families, or 13.1% of filings. G01N, tied to materials investigation and analysis, adds 1,205 families at 10.4%. Smaller but notable clusters include B01D separation technology at 6.8% and C02F, water treatment related filings, at 6.5%. This spread suggests that Huadong’s broader corporate group, or affiliated filing entities captured in this portfolio, maintain significant engineering and infrastructure interests alongside core pharmaceutical work. Business decision makers should treat this technology mix as a signal of diversified R&D investment, not a narrow pharmaceutical-only filing strategy.
How Has the Huadong Patent Portfolio Evolved Across Filing Geographies?
Looking at filing activity by year and jurisdiction together adds useful texture to the broader trend. The heatmap in this section shows China tracking the overall portfolio trajectory almost exactly, rising from 1,252 families in 2016 to a high of 2,949 in 2023. This close correlation confirms that domestic filings drive essentially all of the portfolio’s growth pattern.
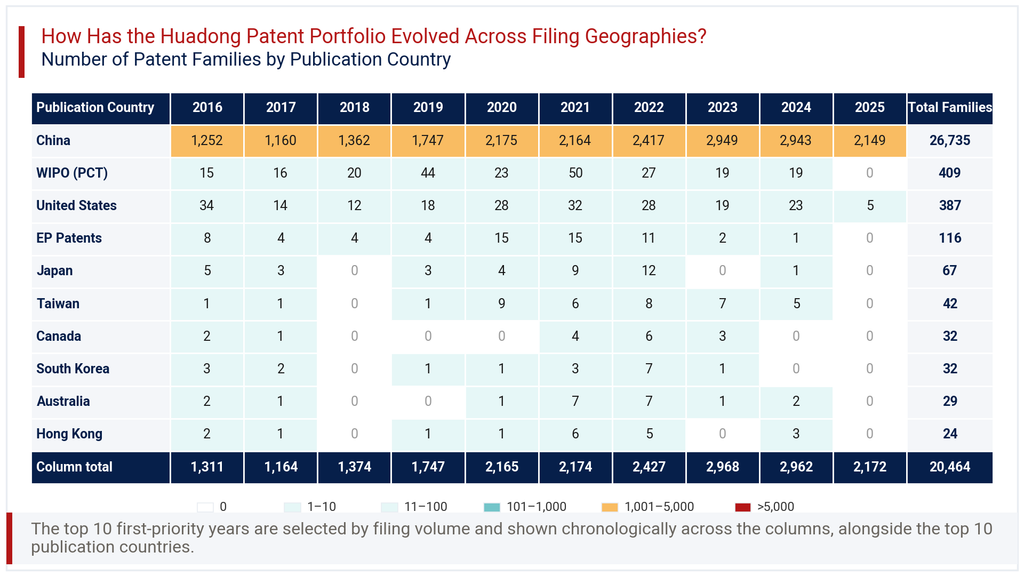
International jurisdictions show much smaller, more irregular movements across the same years. United States filings ranged from 12 to 34 annually between 2016 and 2024, without a clear upward or downward trend. WIPO PCT filings peaked at 50 in 2021 before declining to 19 in both 2023 and 2024. Japan, Taiwan, Canada, South Korea, Australia, and Hong Kong all show single-digit annual counts, with occasional small spikes in 2021 and 2022. The 2025 figures across nearly all non-China jurisdictions drop to near zero, consistent with publication lag rather than an actual halt in international filing activity.
Consultant’s Perspective on Huadong Patent Portfolio
From an advisory standpoint, the Huadong Patent Portfolio presents a picture of deep, domestically anchored filing discipline rather than broad global ambition. The scale, at 26,874 families, is substantial by most industry benchmarks. Yet the 99.5% concentration in China, paired with a grant rate of 49.2%, suggests a filing strategy optimised for local defensibility rather than international enforcement reach.
The technology mix is the more interesting finding here. Engineering-related classes like E02D and E02B outweigh pharmaceutical-specific categories in raw filing volume. This points to either a diversified corporate group structure or significant non-pharma business lines sitting within the same filing entity. Any party conducting due diligence should separate these clusters carefully before drawing conclusions about core drug-related innovation strength.
Looking forward, the company would benefit from monitoring its lapsed rate, currently at 25.8%, since this represents meaningful asset attrition over time. Selective international filing in markets tied to actual commercial expansion, rather than broad geographic spread, would likely yield better returns than wider but thinner global coverage. The portfolio’s domestic depth is a genuine strength; the question is how much of it translates into enforceable value outside China.
Explore Deeper Insights with Expertlancing Research
This overview only scratches the surface of what the Huadong Patent Portfolio can reveal about competitive positioning and technology direction. Expertlancing Research helps clients go further, validating individual patent families, benchmarking against competitors, and building custom intelligence tailored to specific business questions. Whether the goal is licensing due diligence, freedom-to-operate analysis, or technology scouting, our team can turn this data into decisions. Reach out to Expertlancing Research to commission a deeper, tailored study of this portfolio or any competitor set relevant to your strategy.