


The Inventec Patent Portfolio offers a useful window into how one of Taiwan’s largest original design manufacturers protects its engineering output. Across a total of 29,519 patent families, 27.4% remain active, a figure covering both granted and pending cases. Of this body of work, 3,991 families have been granted and 4,104 sit pending before patent offices worldwide. The grant rate stands at 13.5%, while lapsed, expired and revoked families together account for a much larger share of the portfolio, totaling 21,424 cases. These are prosecution and maintenance figures only, not a measure of patent quality or enforceability.
Filing activity peaked prior to 2007, with the pre-2007 bucket alone showing 14,225 families, though yearly filings in the years that followed settled into a lower, steadier pattern. China leads all jurisdictions with a 47.2% share of filings, and the portfolio spans 10 jurisdictions in total. On the technology side, digital data processing under G06F dominates the classification data, accounting for 14,806 families, by far the largest cluster in the portfolio.
This article works through what these numbers mean for anyone assessing Inventec’s innovation activity from outside the company. Filing volume alone does not confirm commercial success, nor does it guarantee a competitive edge in any given market. Readers evaluating specific patent families for licensing, litigation or investment purposes should verify details directly against primary patent office records before acting on them.
About Inventec
Company Profile: Inventec Corporation is a Taiwan based original design manufacturer founded in 1975. The company is a Taiwan-based Original Design Manufacturer making notebook computers, servers and mobile devices. It was originally established to develop and manufacture electronic calculators, and major customers include Hewlett-Packard, Toshiba, Acer, and Fujitsu-Siemens. Inventec has major development and manufacturing facilities in China, one of its largest export markets, with its first development center opened there in 1991 and its first manufacturing facility in Shanghai in 1995.
It also operates configuration and service centers in the United States, Europe, and Mexico. The company employs over 23,000 people, including more than 3,000 engineers. Inventec partially owns Kohjinsha, a Japan-based mini notebook brand vendor established in Yokohama. According to the company’s official website, Inventec is led by Group Chairman Kou-I Yeh, Chairman Sam Yeh, and President Jack Tsai.
How Healthy is Inventec Patent Portfolio?
Patent portfolio health depends heavily on legal status, and Inventec’s numbers tell a mixed story. Lapsed families make up 63.6% of the total, by far the largest single category, followed by pending cases at 13.9% and granted cases at 13.5%. Revoked and expired families add 3.0% and 5.9% respectively. The composition chart in this section shows how heavily the portfolio skews toward lapsed status rather than active protection. This pattern is common for companies with decades of continuous filing, where older families naturally age out of enforceable status over time.
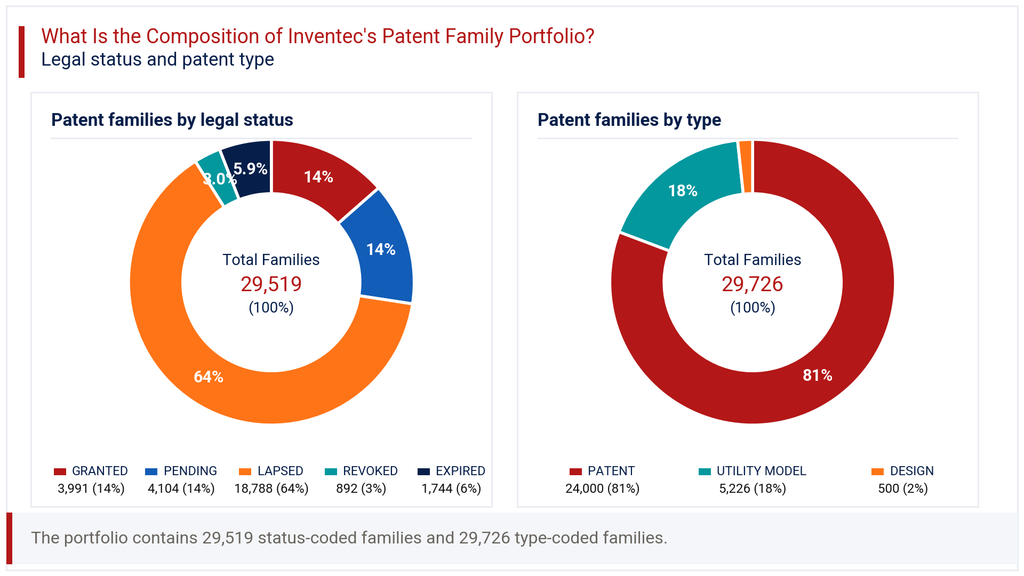
Looking at patent type, standard patents account for 80.7% of filings, utility models for 17.6%, and design patents for a modest 1.7%. This mix suggests Inventec treats formal patent protection as its primary tool, with utility models serving as a secondary, faster route in jurisdictions like China and Taiwan. The active rate of 27.4% confirms that roughly a quarter of the portfolio still carries live rights. For a company of Inventec’s scale and manufacturing footprint, this points to a portfolio built more for historical coverage than for aggressive, ongoing enforcement. Buyers or partners assessing the Inventec Patent Portfolio should focus diligence on the active subset rather than the full historical count.
How Has the Inventec Patent Portfolio Evolved Over Time?
Patent filing trends across Inventec’s history show a clear arc. The pre-2007 period accounts for 14,225 families, reflecting the company’s early and intensive filing activity as it scaled manufacturing operations. Volumes then declined steadily through 2008 (2,345), 2009 (2,156) and 2010 (1,993), continuing downward into the early 2010s. By 2017, annual filings had settled near 406, a much lower plateau than the company’s earlier peak years.
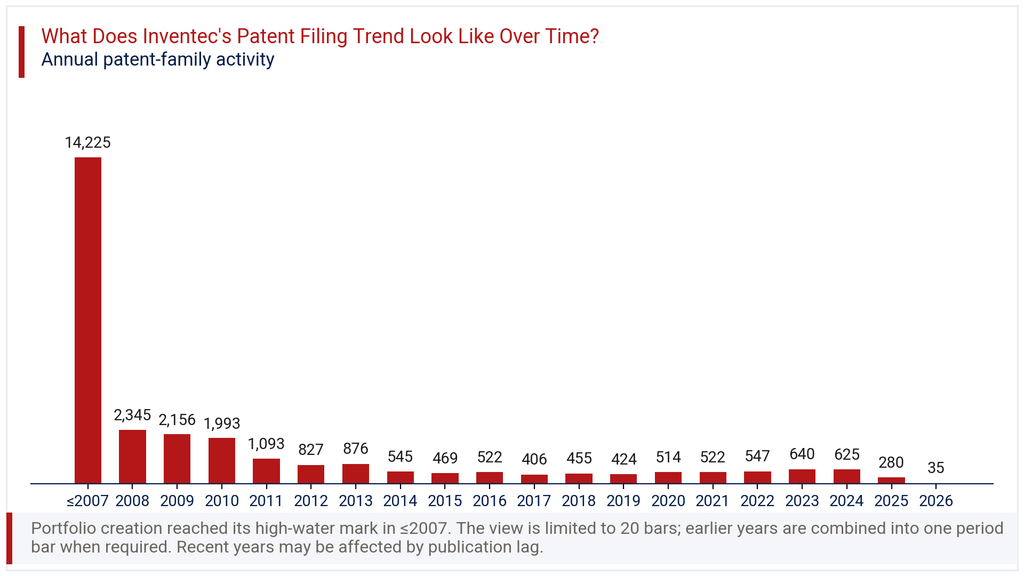
From 2018 onward, filing counts hover in a tighter band, ranging between 406 and 640 annually, with 2023 reaching 640 and 2024 at 625. The filing-trend chart in this section shows this leveling pattern clearly after the sharp early decline. The year 2025 shows only 280 families and 2026 just 35, reflecting a 87.5% drop against the prior year. This should be read as publication lag rather than a genuine fall in filing activity, since recent applications typically take months or years to appear in public records. The broader trend still points to a mature filer settling into steady, moderate annual output rather than aggressive expansion.
Where Does the Inventec Patent Portfolio Prioritize Patent Protection?
Patent geography within the Inventec Patent Portfolio centers heavily on two home markets. China leads with 47.2% of all filings, closely followed by Taiwan at 47.1%, together accounting for the overwhelming majority of the portfolio. The United States trails well behind at 15.2%, still a meaningful share given the cost and complexity of US prosecution. The geographic chart in this section makes this concentration immediately visible.
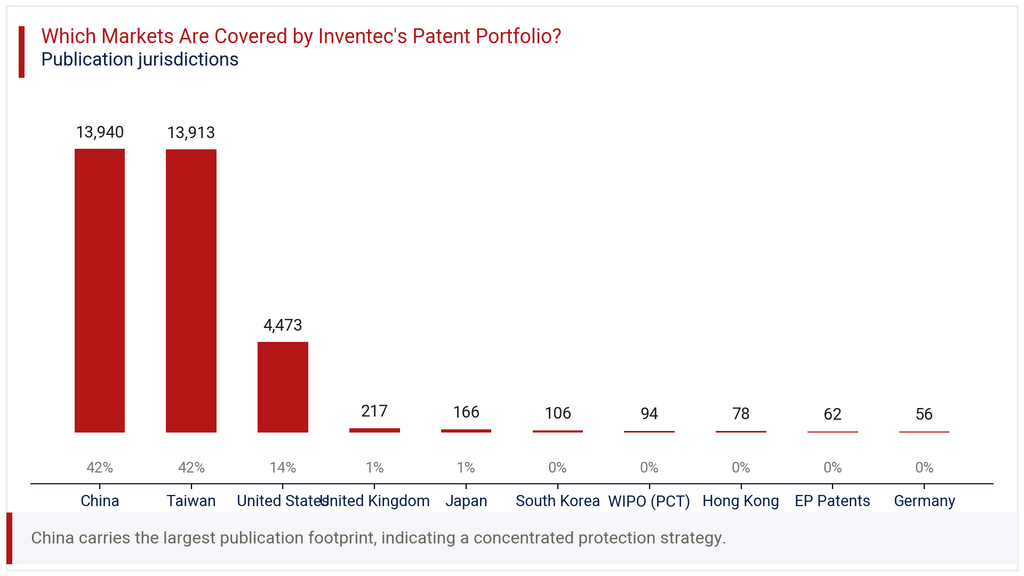
Beyond these three markets, filing activity drops sharply. The United Kingdom holds 0.7%, Japan 0.6%, South Korea 0.4%, and WIPO PCT filings account for just 0.3%. Hong Kong, EP Patents and Germany each sit at 0.2% or below. This pattern reflects a manufacturing-led filing strategy, where protection follows production and primary customer markets rather than broad international coverage. For a contract manufacturer serving global brands, this concentration makes practical sense, since much of the design and engineering work happens close to its China and Taiwan facilities. Companies evaluating competitive overlap with Inventec should weight China and Taiwan filings most heavily in any freedom-to-operate review.
Where is the Inventec Patent Portfolio Building Protection Across Key Technologies?
IPC analysis of the Inventec Patent Portfolio points firmly toward computing hardware and digital systems. The G06F class, covering digital data processing, leads with 14,806 families and a 52.7% share, more than three times the next largest category. H05K, covering printed circuits and casings, follows with 4,794 families and 17.1% share, reflecting the company’s deep hardware manufacturing roots.
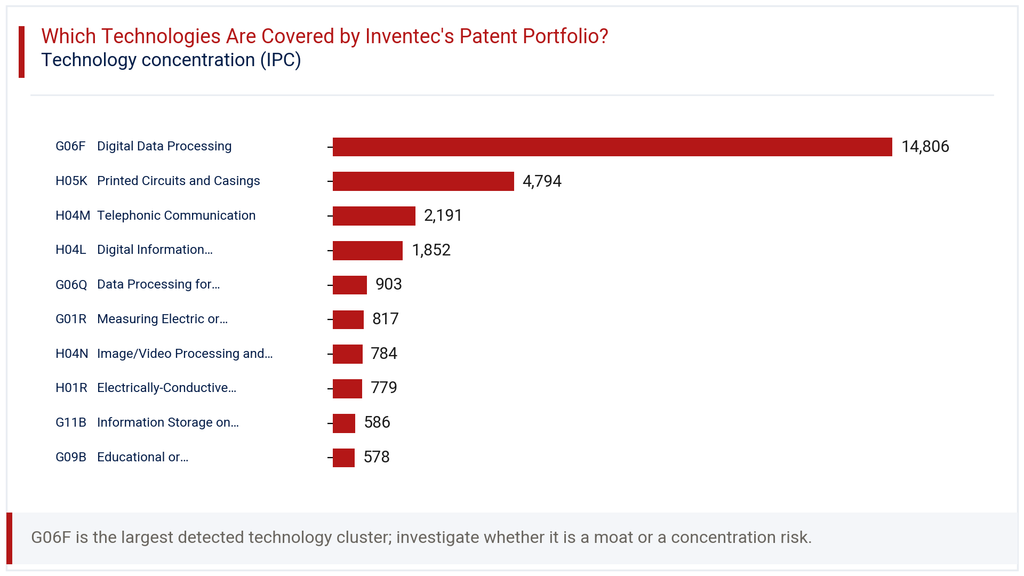
Telephonic communication under H04M accounts for 2,191 families (7.8%), while digital information transmission under H04L adds 1,852 families (6.6%). The technology chart in this section shows a long tail beyond these leaders, including data processing for commercial purposes (G06Q, 3.2%), electric measurement (G01R, 2.9%), and image or video processing (H04N, 2.8%). This spread confirms that while computing and circuit design dominate, Inventec maintains meaningful depth in connectivity, measurement and display technologies. The pattern aligns closely with its product lines of notebooks, servers and mobile devices, where hardware integration and data processing remain central engineering challenges.
How Has the Inventec Patent Portfolio Evolved Across Filing Geographies?
Year-by-jurisdiction data reveals how Inventec’s geographic priorities shifted as its filing volumes changed. In the early 2000s, China and Taiwan ran at similar levels, each in the low hundreds annually, before both climbed sharply through the mid-2000s. China reached 1,274 filings in 2009, while Taiwan peaked earlier at 1,258 in 2006. The heatmap in this section captures this near-parallel growth between the two home markets.
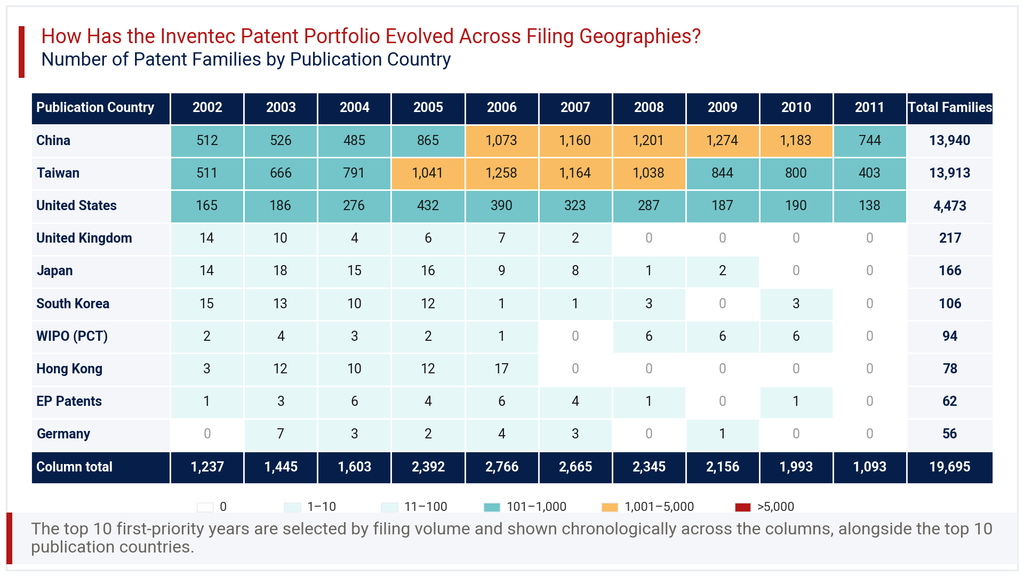
The United States shows a smaller but comparable pattern, rising to 432 filings in 2005 before gradually declining to 138 by 2011. Secondary jurisdictions like the United Kingdom, Japan and South Korea show activity concentrated almost entirely in the early 2000s, tapering to near zero by 2008 onward. Germany, Hong Kong and EP Patents follow a similar fade. This decline across smaller jurisdictions suggests a conscious narrowing of filing strategy, with Inventec consolidating protection around China, Taiwan and the United States as its core markets matured. The heatmap view makes clear that geographic diversification was never sustained beyond the portfolio’s early growth phase.
Consultant’s Perspective on Inventec Patent Portfolio
Taken as a whole, the Inventec Patent Portfolio reads as the output of a disciplined, manufacturing-anchored filer rather than an aggressive IP accumulator. The heavy concentration in China and Taiwan, paired with a dominant computing and hardware technology base, mirrors the company’s core business as an original design manufacturer. The high lapsed rate of 63.6% is not unusual for a portfolio this old, but it does mean current enforceable rights are considerably smaller than headline family counts suggest.
What stands out most is the steady, moderate filing pace since 2017, holding between roughly 400 and 650 families a year. This suggests Inventec continues investing in protection around incremental engineering improvements rather than pursuing a new growth category. For competitors or partners, the practical takeaway is to focus diligence on the active 27.4% of the portfolio, concentrated in China and Taiwan. Anyone studying the Inventec Patent Portfolio for competitive intelligence should pair these filing patterns with product roadmap and customer contract analysis for a fuller picture. The data alone frames the shape of the business, not its current market strength.
Explore Deeper Insights with Expertlancing Research
This overview only scratches the surface of what the Inventec Patent Portfolio can reveal about the company’s technology direction and market priorities. Expertlancing Research helps clients go further, validating individual patent families, mapping competitive overlaps, and tracking filing behavior against product launches. Whether you need due diligence support, licensing intelligence, or a detailed technology landscape study, our analysts can tailor the research to your specific business question. Reach out to Expertlancing Research to turn this data into a decision-ready briefing.