


The Jiangsu Hengrui Patent Portfolio offers a useful window into how one of China’s largest pharmaceutical companies protects its research output. Across 2062 patent families, 79.8% remain active, a figure that covers both granted and pending cases together. Of these, 915 have been granted and 730 are still pending before patent offices worldwide. The grant rate stands at 44.4%, while 417 families fall into lapsed, revoked or expired categories combined. These are prosecution and maintenance metrics only, not a verdict on patent quality or enforceability.
Filing activity peaked in 2021, when the company filed 246 patent families, the highest single-year count in the portfolio. China dominates as the top jurisdiction, accounting for 88.0% of filings, and the portfolio spans 10 jurisdictions in total. On the technology side, IPC class A61K (preparations for medical purposes) leads with 1473 families, making it the most heavily populated cluster in the entire body of filings.
This report is built to help readers understand filing patterns, not to draw conclusions about commercial outcomes or market share. Patent counts alone cannot confirm that a product has succeeded or that a competitor holds an edge. Anyone using this analysis for diligence, licensing or competitive benchmarking should verify specific families independently. The following sections walk through legal status, filing trends, geographic spread, technology concentration and year-by-jurisdiction movement in turn.
About Jiangsu Hengrui
Company Profile: Jiangsu Hengrui Pharmaceuticals Co., Ltd., also known as Hengrui Pharma, is a Chinese pharmaceutical company. It is an innovation-driven, global pharmaceutical company dedicated to the research, development and commercialization of high-quality medicines to address unmet clinical needs. Its therapeutic areas include oncology, metabolic and cardiovascular diseases, immunological and respiratory diseases, and neuroscience.
Driven by a patient-focused philosophy since its founding in 1970, Hengrui Pharma remains committed to advancing human health through science and technology. The company has been ranked on Pharma Exec’s annual list of the top 50 global pharmaceutical companies for eight consecutive years, and has remained on Citeline’s list of top 25 global pharma companies by pipeline size for five consecutive years, ranking second globally by independently developed pipeline assets. Sixteen R&D centers were built around the world, with subsidiaries established in the US, EU, Australia, and Japan.
Scientific and technological innovation remains its primary development strategy, backed by continued R&D investment. It trades under stock codes 600276.SH and 01276.HK.
How Healthy is Jiangsu Hengrui Patent Portfolio?
Patent portfolio health depends heavily on legal status composition, and the Jiangsu Hengrui Patent Portfolio shows a reasonably strong position here. Granted patents make up 44.4% of all families, while pending applications contribute another 35.4%, giving the combined active share of 79.8%. Lapsed filings account for 14.5%, revoked cases sit at 5.5%, and expired patents are a negligible 0.2%. The composition chart in this section illustrates how these categories stack against each other across the full portfolio.
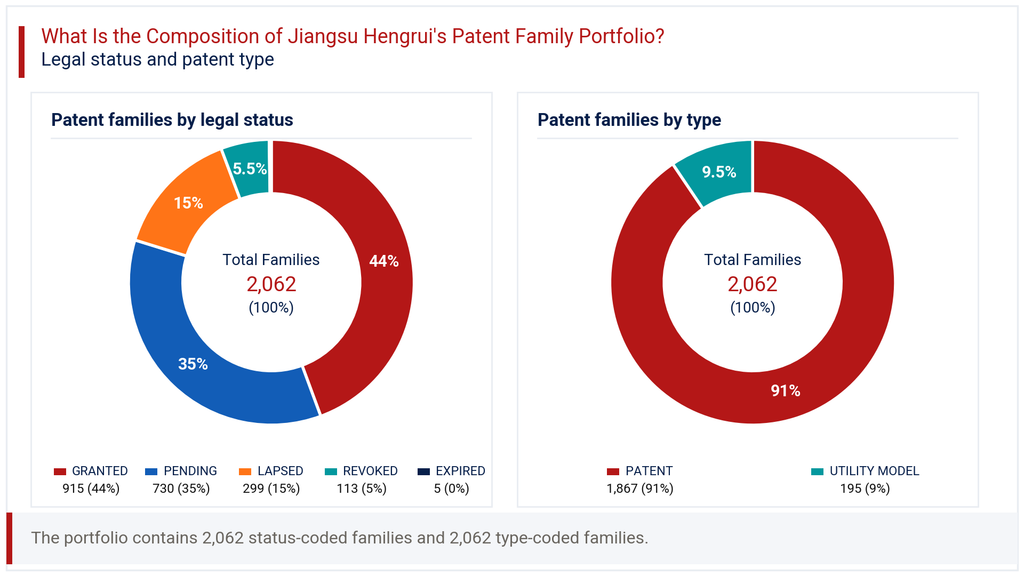
Patent type adds another layer of insight. Standard patents represent 90.5% of filings, while utility models account for the remaining 9.5%. This split suggests the company leans toward full-term protection rather than shorter-duration utility filings, consistent with a research organization pursuing durable coverage for drug compounds and formulations. The relatively low revocation share, at 5.5%, points to filings that have generally withstood opposition or invalidation challenges once granted. Taken together, the legal status mix indicates a portfolio that is more active than dormant, though the sizeable pending share also means a meaningful portion of claims await final examination outcomes before their protection scope becomes certain.
How Has the Jiangsu Hengrui Patent Portfolio Evolved Over Time?
Patent filing trends across the Jiangsu Hengrui Patent Portfolio reveal a company that filed modestly through the 2000s before accelerating sharply after 2015. Annual filings ranged between 14 and 51 families in the years up to 2015, then jumped to 79 in 2016 and kept climbing. The filing-trend chart in this section shows a clear inflection point starting around 2016, with 2021 marking the peak year at 246 families filed.
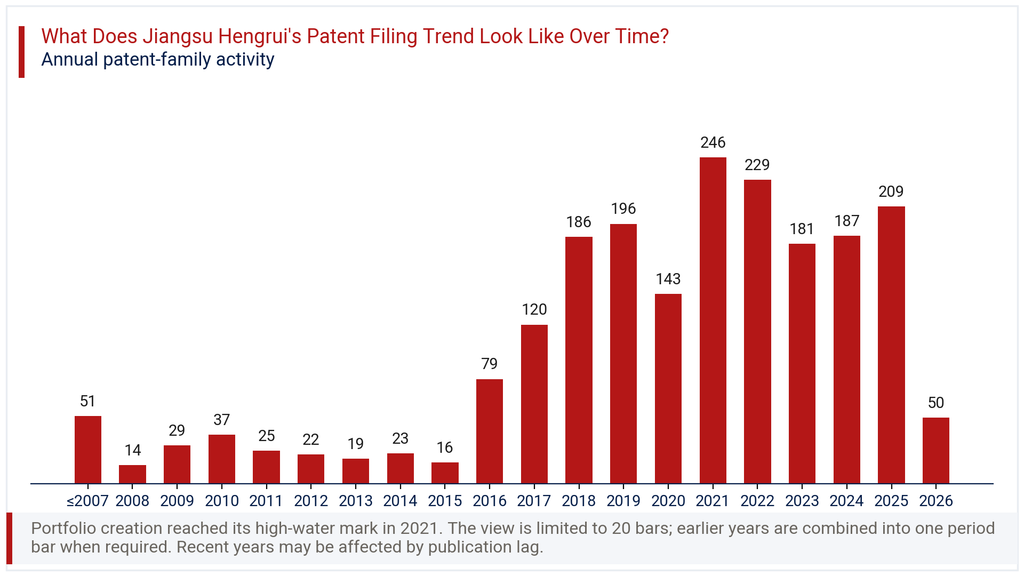
Volumes stayed strong through 2022 (229), 2023 (181) and 2024 (187), before 2025 recorded 209 families. The apparent 76.1% drop in the most recent year reflected in latest_year_change_pct should be read cautiously. Publication lag typically distorts the last one to two years of any patent dataset, since many applications filed recently have not yet published or been indexed. Rather than signaling a genuine pullback in research output, this dip most likely reflects filings still working through the examination and disclosure pipeline. The broader decade-long trajectory still points toward sustained, elevated filing activity compared to the pre-2016 period.
Where Does the Jiangsu Hengrui Patent Portfolio Prioritize Patent Protection?
Patent geography within the Jiangsu Hengrui Patent Portfolio centers heavily on the home market. China accounts for 88.0% of all filings, by far the largest share, reflecting the company’s deep domestic research base and regulatory familiarity. The geographic chart in this section ranks the remaining jurisdictions, led by WIPO PCT filings at 42.3%, a common route for companies planning broader international expansion later.
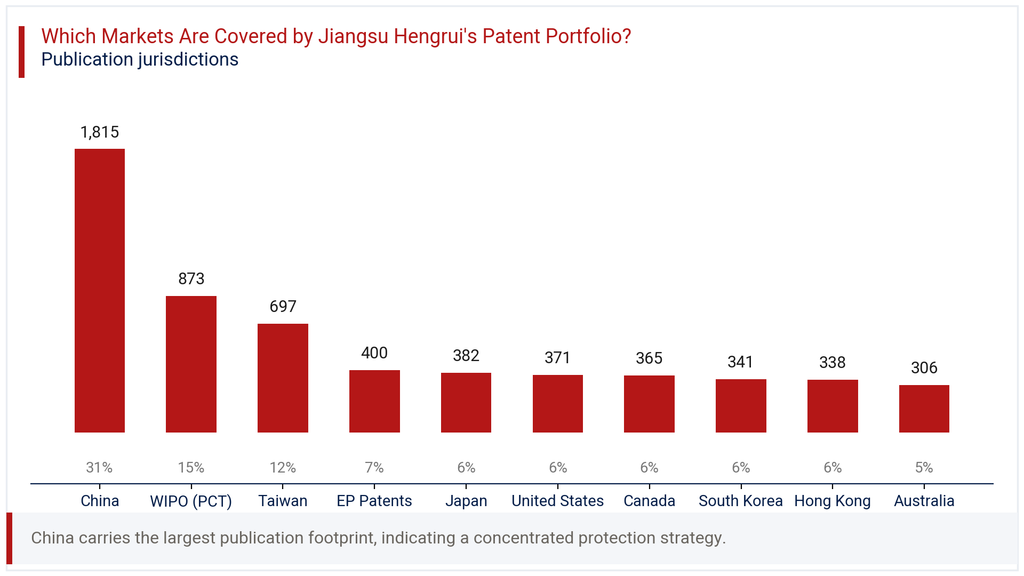
Beyond China and the PCT system, Taiwan holds 33.8% of filings, followed by EP Patents at 19.4%, Japan at 18.5%, and the United States at 18.0%. Canada, South Korea, Hong Kong and Australia each carry shares between 14.8% and 17.7%. This spread across 10 jurisdictions suggests a company building international coverage selectively, prioritizing markets with strong pharmaceutical regulatory frameworks and commercial potential. The gap between China’s dominant share and the next-largest jurisdictions indicates that global expansion, while present, remains secondary to securing comprehensive domestic protection first.
Where is the Jiangsu Hengrui Patent Portfolio Building Protection Across Key Technologies?
IPC analysis of the Jiangsu Hengrui Patent Portfolio points clearly toward core pharmaceutical science. Class A61K, covering preparations for medical purposes, leads with 1473 families and a 30.8% share. Class A61P, covering therapeutic activity of compounds, follows closely with 1418 families at 29.7%. The technology chart in this section shows these two classes well ahead of every other category tracked.
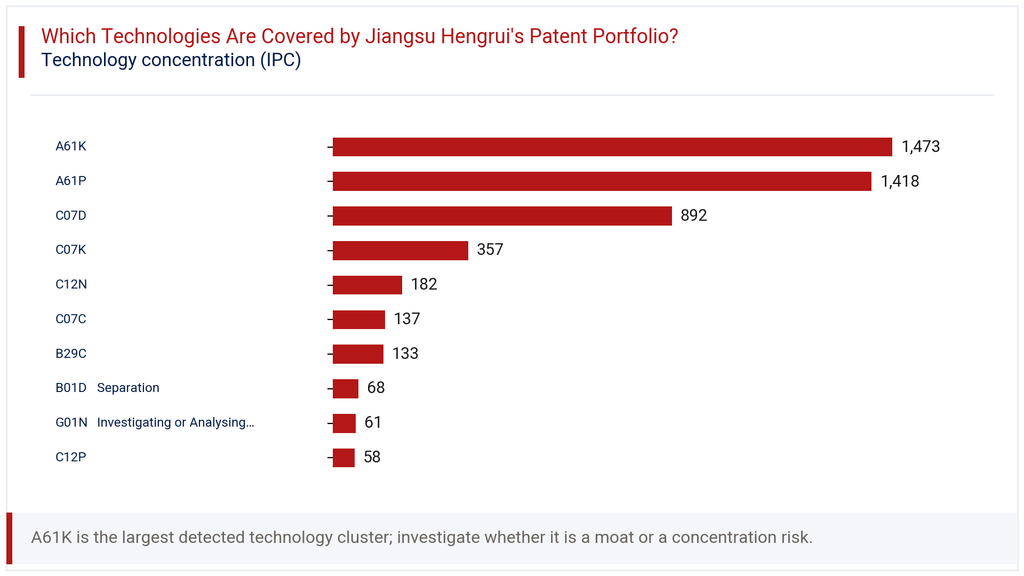
Organic chemistry class C07D ranks third with 892 families (18.7%), while peptide-related class C07K holds 357 families (7.5%). Smaller but notable clusters include C12N (microorganism and genetic engineering techniques) at 3.8%, and C07C (acyclic compounds) at 2.9%. This concentration confirms that the company’s research and development effort centers on drug substance and therapeutic application claims rather than peripheral manufacturing or testing technologies. The dominance of A61K and A61P together, representing roughly 60% combined, reflects a portfolio built around core medicinal chemistry and treatment methods, consistent with an oncology and chronic disease focused pharmaceutical business.
How Has the Jiangsu Hengrui Patent Portfolio Evolved Across Filing Geographies?
The heatmap in this section tracks filing volumes by jurisdiction and year, revealing how international filing patterns shifted alongside the domestic surge. China’s filings rose from 60 in 2015 to a peak of 231 in 2021, before easing to 126 by 2024. WIPO PCT filings followed a similar arc, climbing from 30 to 94 at their 2021 high point, then settling at 108 in 2024.
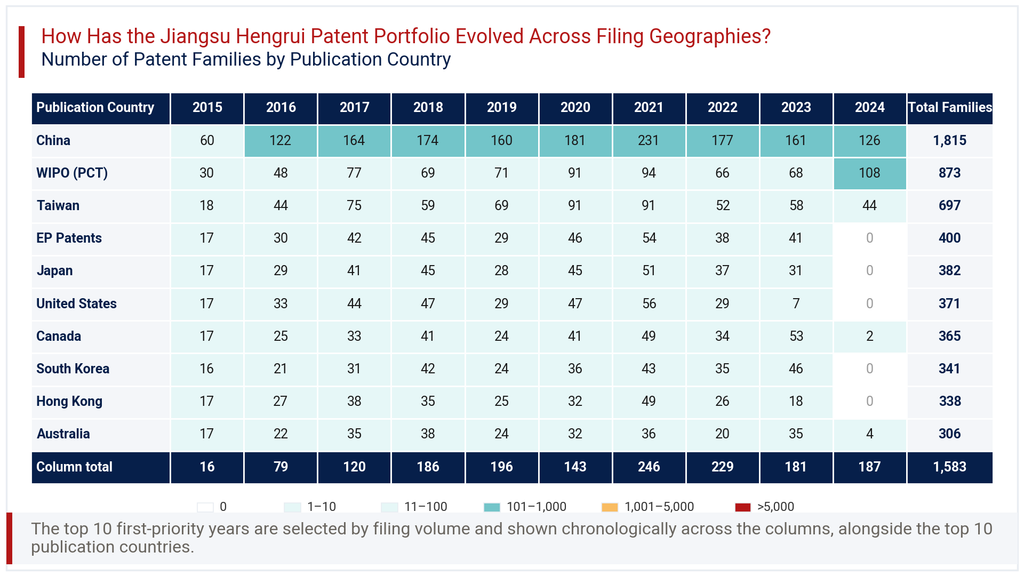
Several jurisdictions, including EP Patents, Japan, United States, South Korea and Hong Kong, show steep declines to single digits or zero by 2024. This pattern across multiple markets simultaneously strongly suggests publication lag rather than an actual halt in filing activity. Canada and Australia show smaller but still-present 2024 figures, at 2 and 4 respectively, reinforcing that the most recent year across all jurisdictions remains incomplete in the data. Readers should treat 2023 as the most reliable recent year for cross-jurisdiction comparison, with 2024 figures expected to rise as records are updated.
Consultant’s Perspective on Jiangsu Hengrui Patent Portfolio
From an advisory standpoint, the Jiangsu Hengrui Patent Portfolio reflects a company that has scaled its research protection considerably since 2016. The filing surge coincides with China’s broader push toward innovative drug development, and Hengrui appears to have moved with that shift rather than against it. The 79.8% active rate is a healthy signal, though the 35.4% pending share means outcomes for a meaningful part of the portfolio are still being determined by patent offices.
The concentration in A61K and A61P classes, together close to 60% of filings, confirms a company staying close to its therapeutic core rather than diversifying into unrelated technology areas. The geographic tilt toward China, at 88.0%, is reasonable given the domestic market size, but it also means international competitors should watch PCT and EP filing trends closely as early signals of global expansion intent.
My recommendation for any party evaluating this portfolio, whether for licensing, competitive tracking or investment due diligence, is to pair this filing-level analysis with claim-level review of the most active IPC clusters. Aggregate counts tell a directional story; specific claims tell the commercial one.
Explore Deeper Insights with Expertlancing Research
This overview of the Jiangsu Hengrui Patent Portfolio shows what aggregate filing data can reveal, and where its limits lie. For decisions involving licensing, freedom-to-operate checks, or competitive benchmarking, deeper claim-level and family-level analysis becomes necessary. Expertlancing Research works with businesses, law firms and investors to turn patent data into decision-ready intelligence. Reach out to our team to commission a tailored study on Jiangsu Hengrui or any competitor portfolio relevant to your strategy.