

The Konka Patent Portfolio offers a useful lens into how a long-standing Chinese electronics manufacturer manages its intellectual property over decades. Across 7,783 total patent families, 36.3% remain active, a figure that covers both granted and pending cases together. Of these, 2,075 families have been granted and 750 remain pending, giving a grant rate of 26.7%. The remaining families, totaling 4,958 (combining lapsed, revoked and expired cases), have exited active protection. These are prosecution and maintenance metrics only, not a verdict on patent quality or enforceability.
Filing activity peaked at 1,154 families in the pre-2007 bucket, though more granular annual peaks appear later, with 890 families filed in 2020. China dominates as the top jurisdiction, holding 98.2% of filings across a portfolio that spans 10 distinct jurisdictions. On the technology side, H04N (Image/Video Processing and Display) leads decisively, accounting for 2,380 families, the largest single cluster by a wide margin.
This report draws on filing, legal status and classification data to build a picture of Konka’s patenting behavior over time. Filing counts alone do not confirm commercial success, product adoption or a lasting competitive edge in the market. Readers evaluating specific families for licensing, litigation or acquisition purposes should independently verify status and claims before relying on this analysis for business decisions.
About Konka
Company Profile: Konka Group Co., Ltd. is a Chinese electronics manufacturer headquartered in Shenzhen, Guangdong. KONKA Group Co., Ltd. was founded on May 21st, 1980, as the first sino-foreign joint venture electronic manufacturer upon China’s reform and opening. Konka makes consumer electronics and white goods, such as televisions, refrigerators, washing machines and air conditioners. It has also introduced mobile devices, including mobile phones and tablets as well as smartwatches and mobile accessories, and has expanded into financial investments and PaaS. The company reports a strategic transformation into an industrial strategic innovator, industrial real estate developer, and Internet and supply chain service provider. It reports increasing strategic investments in core technologies such as Micro LED, 8K, AIoT and 5G. The company reports business covering over 110 countries and regions, with three overseas factories and three overseas branches.
It is listed on the Shenzhen Stock Exchange and owned by Overseas Chinese Town Enterprises.
How Healthy is Konka Patent Portfolio?
Patent portfolio health depends heavily on legal status distribution, and Konka’s numbers tell a layered story. Granted patents make up 26.7% of the total, while pending applications add another 9.6%, together forming the active base. Lapsed families represent the largest single group at 42.8%, followed by revoked cases at 20.0%. Expired patents are a small sliver at 0.9%. The composition chart in this section shows this split clearly, with lapsed and revoked cases together outweighing the active share.
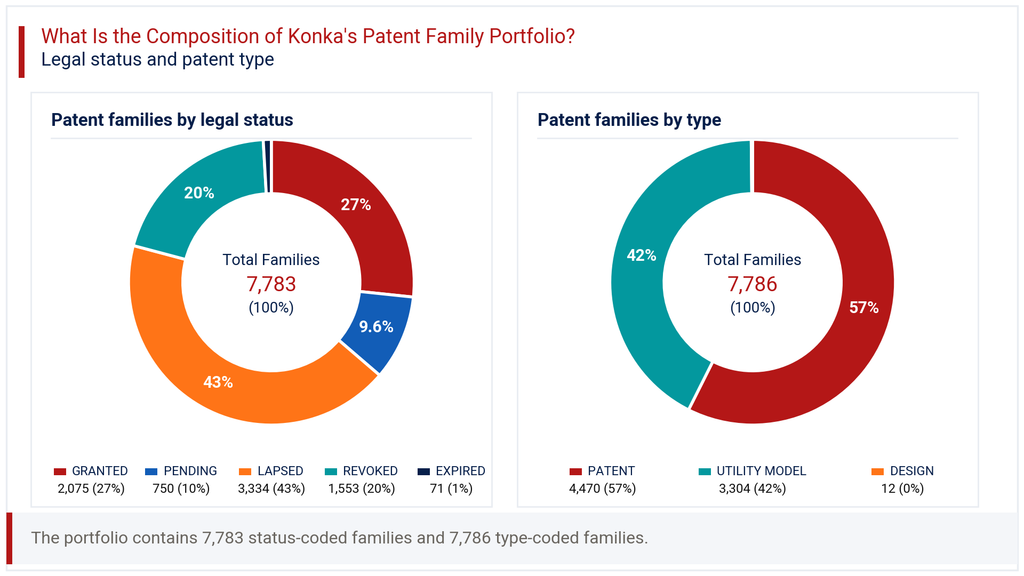
This pattern is fairly typical for a company with a long filing history stretching back decades. Older filings naturally lapse as maintenance fees lapse or protection terms run out. On patent type, utility models and design filings together with standard patents shape a mixed protection strategy. Patents account for 57.4% of filings, utility models for 42.4%, and design filings a mere 0.2%. This heavy reliance on utility models, common in Chinese filing practice, suggests Konka prioritizes faster, lower-cost protection routes alongside its standard patent filings, particularly for incremental engineering improvements in consumer electronics and appliances.
How Has the Konka Patent Portfolio Evolved Over Time?
Patent filing trends across Konka’s history reveal several distinct phases rather than one steady climb. Filings before 2007 totaled 1,154 families, reflecting strong early activity tied to the company’s founding decades. Volumes stayed elevated through 2008 (645) and 2009 (687), before sliding through the early 2010s to a low of 129 in 2016. The filing-trend chart in this section shows this decline followed by a sharp rebound.
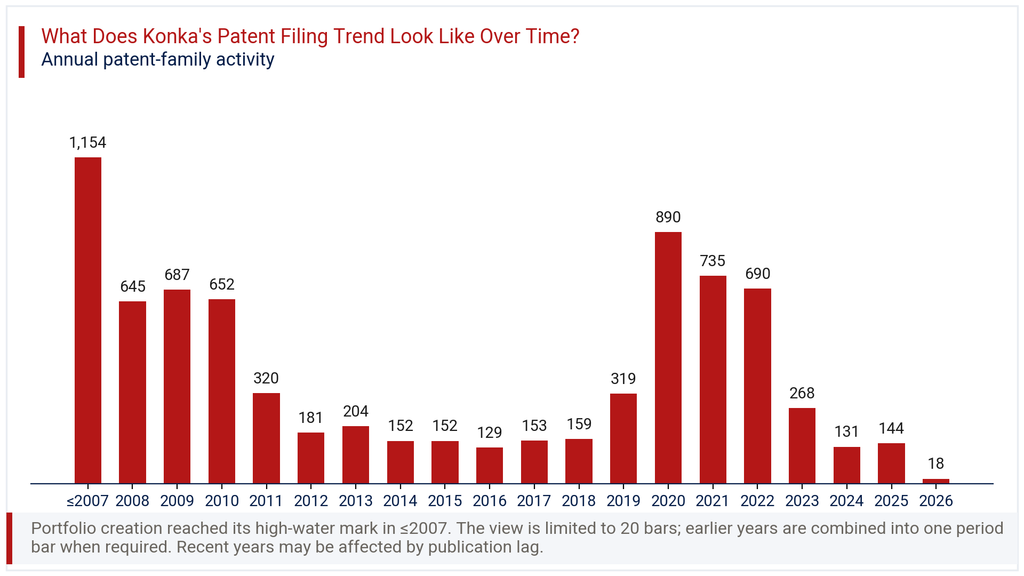
That rebound is striking: filings jumped from 319 in 2019 to 890 in 2020, then held relatively strong at 735 in 2021 and 690 in 2022. This surge likely reflects renewed investment in core technologies such as display and semiconductor innovation. Numbers then taper to 268 in 2023, 131 in 2024, and 144 in 2025, with a -87.5% change noted for the latest year. This drop should be read cautiously, since publication lag typically understates recent filings until records catch up, rather than signaling an actual pullback in research activity.
Where Does the Konka Patent Portfolio Prioritize Patent Protection?
Patent geography within Konka’s portfolio is overwhelmingly concentrated in its home market. China accounts for 98.2% of all filings, a dominant share that reflects the company’s roots and primary commercial footprint. The geographic chart in this section illustrates just how narrow the international spread is compared to the domestic base. WIPO filings via the PCT route follow at 3.0%, offering a pathway for selective international expansion.
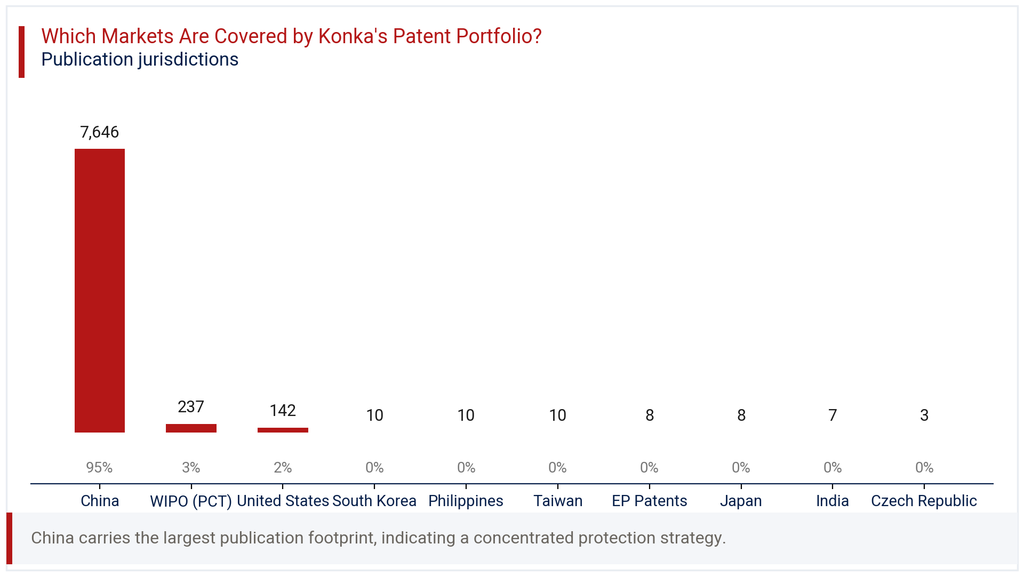
The United States holds 1.8% of filings, trailing distantly behind China and PCT applications. Smaller jurisdictions, including South Korea, the Philippines, Taiwan, EP Patents, Japan, India and the Czech Republic, each hold 0.1% or less. Across all 10 jurisdictions tracked, this distribution signals a company whose patent protection strategy centers on securing its domestic manufacturing and sales base first. International filings appear selective, likely reserved for markets where Konka sees direct commercial relevance, rather than broad global coverage.
Where is the Konka Patent Portfolio Building Protection Across Key Technologies?
IPC analysis of Konka’s filings points to a clear technology focus. H04N, covering image and video processing and display, leads with 2,380 families, representing 34.8% of the portfolio. This aligns naturally with Konka’s core television and display manufacturing business. The technology chart in this section shows this cluster towering over every other category tracked.
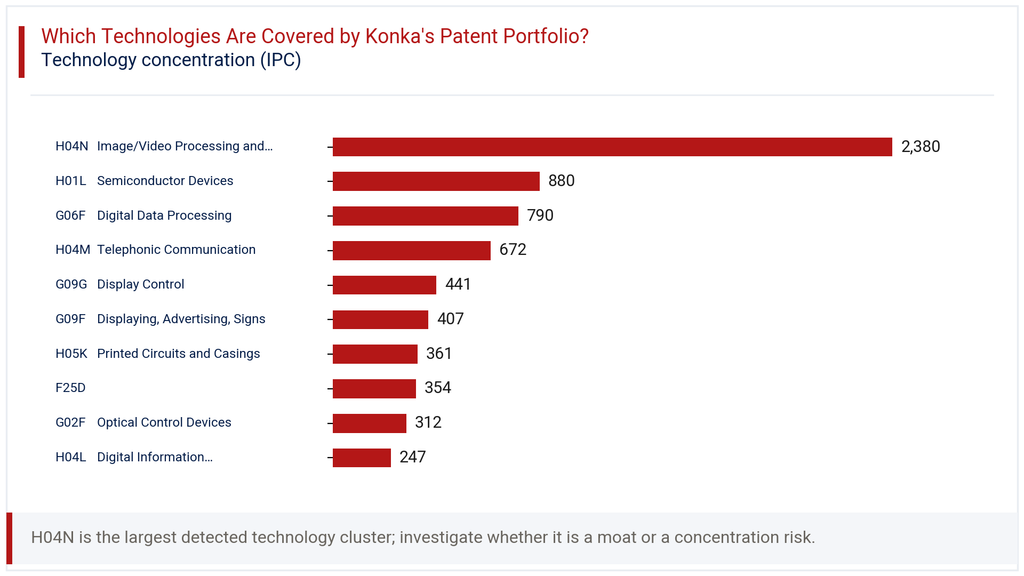
H01L (Semiconductor Devices) follows at 880 families (12.9%), and G06F (Digital Data Processing) ranks third with 790 families (11.5%). H04M (Telephonic Communication) holds 672 families (9.8%), reflecting the company’s mobile device ventures. Smaller but meaningful clusters include G09G Display Control (441, 6.4%), G09F Displaying and Signs (407, 5.9%), H05K Printed Circuits (361, 5.3%), F25D refrigeration technology (354, 5.2%), G02F Optical Control (312, 4.6%), and H04L Digital Information Transmission (247, 3.6%). This spread confirms display and imaging technology as Konka’s clear innovation anchor, with semiconductor and computing patents providing meaningful secondary depth.
How Has the Konka Patent Portfolio Evolved Across Filing Geographies?
Looking at filings by year and jurisdiction together adds texture to the overall trend. China’s domestic filings tracked closely with the company’s broader volume pattern, rising from 317 in 2006 to 688 in 2009, dipping through the early 2010s, then climbing again to 839 in 2020 and staying near 690 in 2021 and 2022. The heatmap in this section makes this parallel movement easy to spot.
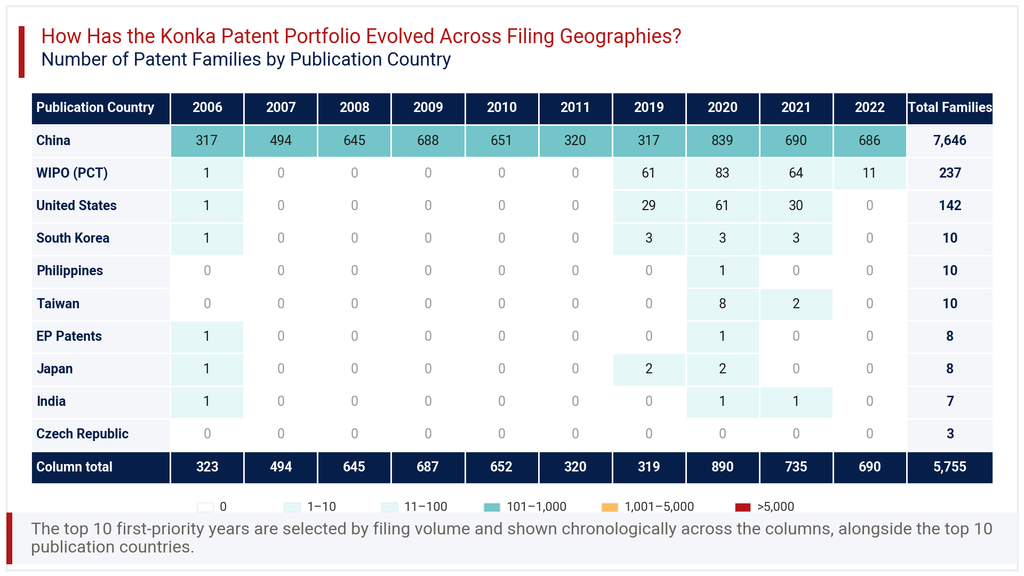
International filing activity, by contrast, stayed nearly dormant for years before the 2019-2020 window. WIPO PCT filings jumped from 0 in the 2006-2011 range to 61 in 2019 and 83 in 2020. United States filings followed a similar arc, rising to 29 in 2019 and 61 in 2020, before falling back toward zero by 2022. Smaller jurisdictions like South Korea, Taiwan and Japan saw brief upticks during this same 2019-2021 window, suggesting a short, deliberate push toward international filing rather than a sustained global expansion strategy.
Consultant’s Perspective on Konka Patent Portfolio
From an advisory standpoint, the Konka Patent Portfolio reads as a domestically anchored, technically focused body of intellectual property. The heavy concentration in China (98.2%) and in display and imaging technology (34.8% via H04N) confirms a company protecting its core manufacturing strengths close to home. The 2019-2021 international filing spike is worth watching closely. It may signal early-stage ambitions toward broader global licensing or export-market protection.
The active rate of 36.3% and grant rate of 26.7% suggest a portfolio with meaningful but not exceptional prosecution efficiency, typical for a company balancing volume filing with selective quality control. Lapsed and revoked cases combined exceed 60% of total families, a reminder that much of Konka’s historical filing activity has already run its course. For buyers, licensors or competitors assessing this portfolio, the practical recommendation is to prioritize due diligence on the active 2,825 granted-plus-pending families, particularly those within the H04N and H01L clusters, where commercial relevance and enforceability potential appear strongest. Monitoring whether the 2020-2021 international push resumes will matter for anyone tracking Konka’s global IP ambitions.
Explore Deeper Insights with Expertlancing Research
Understanding a patent portfolio at this level of detail takes more than reading raw numbers. Expertlancing Research helps clients translate filing data, legal status and technology clustering into decisions that matter, whether for competitive benchmarking, licensing negotiations or acquisition due diligence. If this overview of Konka’s patenting activity raises further questions, our research team can build a more targeted analysis around your specific business need. Reach out to explore how deeper patent intelligence can support your next strategic decision.