


The Lead Intelligent Patent Portfolio spans 4072 patent families, built up over nearly two decades of filing activity. Of these, 84.8% remain active, a figure that covers both granted and pending cases. Granted patents number 3074, while 379 applications are still pending examination. The grant rate stands at 75.5%, a reasonably strong conversion figure for a hardware-heavy filer. The remaining families, totalling 619 across lapsed, expired and revoked status, reflect normal portfolio attrition. These are prosecution and maintenance metrics only, not a verdict on patent quality or enforceability.
Filing activity peaked in 2019, when the company filed 659 new families in a single year, the busiest year on record. China dominates the filing geography, accounting for 98.6% of all families, across a portfolio spread over 10 jurisdictions. The leading technology cluster is H01M, covering batteries and cells, with 1489 families, representing close to two in five of all filings. This concentration signals where Lead Intelligent has placed its heaviest research and protection bets.
This report draws on patent filing data to map where Lead Intelligent has built protection and how that protection has shifted over time. Filing volume alone does not confirm commercial success, market share or competitive advantage in any given country. Readers planning to use this analysis for investment, partnership or competitive assessment should verify specific families independently. The following sections unpack legal status, filing trends, geography and technology concentration in more depth.
About Lead Intelligent
Company Profile: Wuxi Lead Intelligent Equipment Co., Ltd., known as LEAD, is a Chinese manufacturer of intelligent new energy equipment. Founded in 2002, it is listed on the Shenzhen Stock Exchange ChiNext board since 2015 under stock code 300450.SZ, and listed on the Hong Kong Stock Exchange since 2026 under code 0470.HK. The company designs equipment for lithium-ion battery, photovoltaic, 3C electronics, automotive, hydrogen fuel cell, smart logistics and laser precision processing sectors.
LEAD operates 2 million square meters of R&D and manufacturing facilities worldwide, invests over 10% of annual revenue into research, employs more than 5,000 R&D professionals, and holds over 3,800 authorized patents. LEAD established its European headquarters in Nuremberg, Germany in 2021, followed by its first European production plant in Naila in 2022.
The company won a whole line Li-ion battery equipment order from Northvolt in Europe. LEAD counts major global battery and electronics manufacturers among its clients.
How Healthy is Lead Intelligent Patent Portfolio?
Patent portfolio health for Lead Intelligent looks solid on paper. Granted patents account for 75.5% of all families, with another 9.3% still pending. Together these active cases make up 84.8% of the entire portfolio, as shown in the composition chart. Lapsed families sit at 10.0%, while revoked and expired cases add 3.5% and 1.7% respectively. This distribution points to a filer that generally sees applications through to grant rather than abandoning them early.
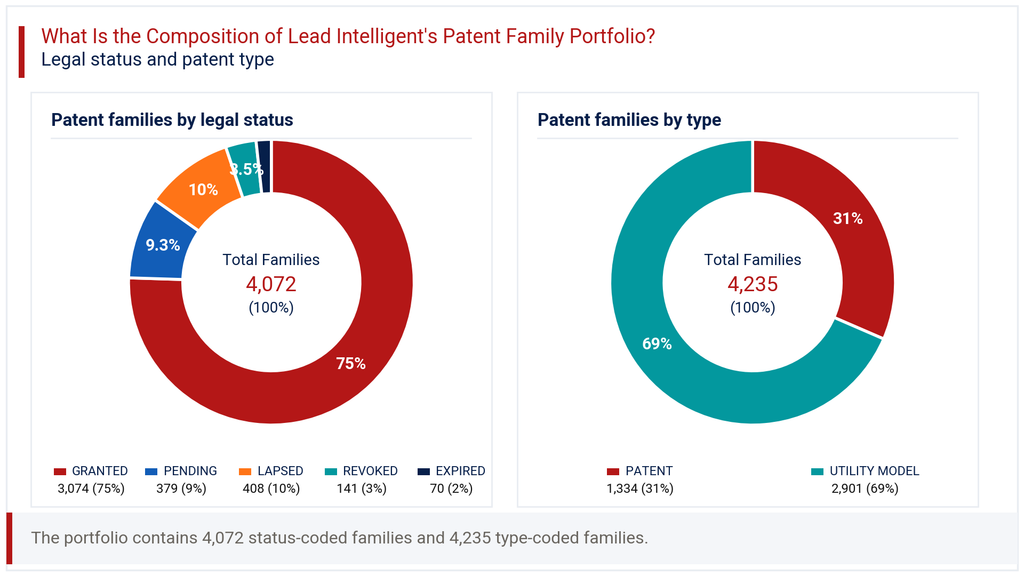
The patent-type split tells a different story about protection depth. Utility models make up 68.5% of the portfolio, well ahead of standard patents at 31.5%. This mix is typical for Chinese equipment manufacturers, since utility models grant faster but carry shorter terms and lighter examination. It suggests Lead Intelligent favours speed to protection over the longer scrutiny of invention patents. For a reader assessing competitive risk, this matters because utility models generally offer narrower legal defensibility than fully examined patents.
How Has the Lead Intelligent Patent Portfolio Evolved Over Time?
Patent filing trends at Lead Intelligent show a sharp climb starting in 2016, when filings jumped to 125 from just 20 a year earlier. Growth accelerated through 2017 (193) and 2018 (366), reaching a high of 659 in 2019. The filing-trend chart captures this buildup clearly, alongside the moderation that followed. Filings dipped to 588 in 2020 and 310 in 2021, before climbing again to 387 in 2023 and 531 in 2024.
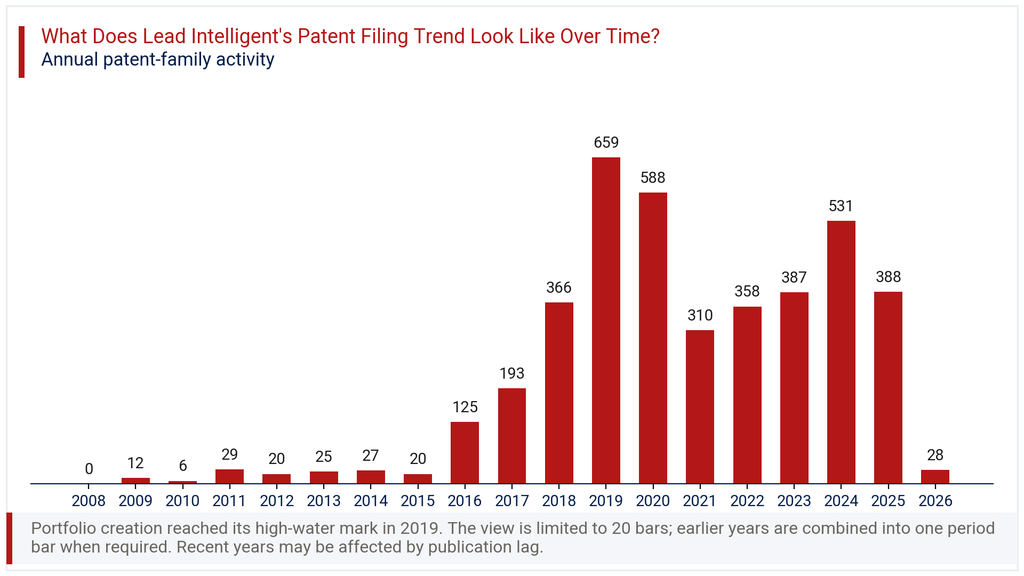
Recent years need a careful read. The 2026 figure of just 28 families reflects a partial year, not a collapse in activity. The reported year-on-year change of -92.8% for the latest period reflects this same publication lag. Patent applications typically take many months to appear in public databases after filing. Readers should treat the final one to two years as incomplete rather than as evidence of declining research investment at Lead Intelligent.
Where Does the Lead Intelligent Patent Portfolio Prioritize Patent Protection?
Patent geography for Lead Intelligent is heavily domestic. China accounts for 98.6% of all filed families, a concentration visible immediately in the geographic chart. This reflects the company’s manufacturing base and the scale of its home market for battery and electronics equipment. No other single jurisdiction comes close to this share.
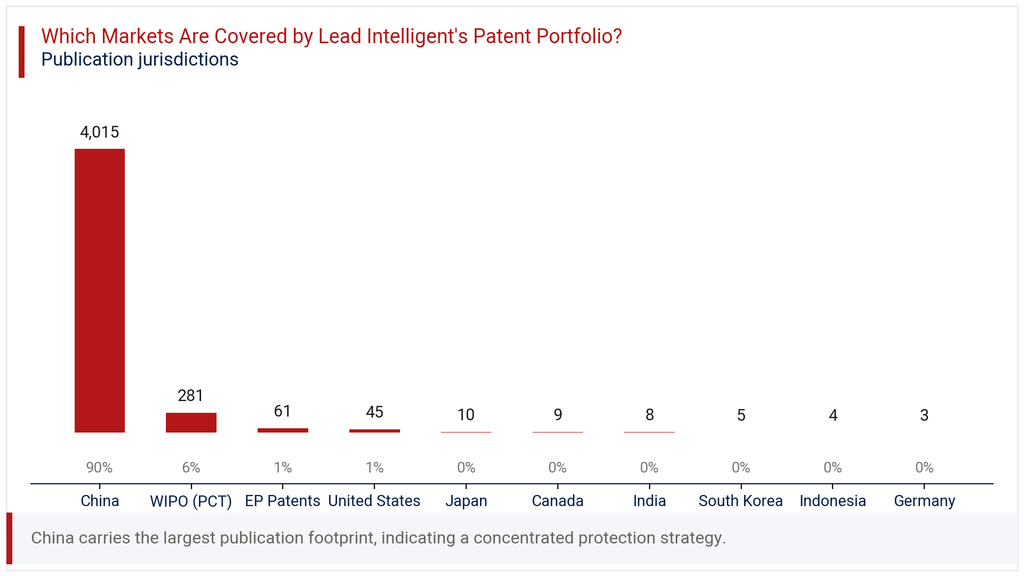
International filing exists but remains modest in scale. WIPO PCT applications represent 6.9% of the portfolio, the main route Lead Intelligent uses to keep international options open. European patents follow at 1.5%, with the United States at 1.1%. Smaller counts appear in Japan, Canada, India, South Korea, Indonesia and Germany, rounding out a total of 10 jurisdictions. This pattern suggests a company still building its global IP footprint, likely tracking its European production expansion and international client relationships rather than pursuing broad worldwide coverage from the outset.
Where is the Lead Intelligent Patent Portfolio Building Protection Across Key Technologies?
The technology chart in this section highlights a clear core focus for Lead Intelligent’s IPC analysis. Batteries and cells, classified under H01M, lead with 1489 families, or 39.2% of the portfolio. This aligns directly with the company’s position as a lithium-ion battery equipment manufacturer. Transport and storage devices under B65G follow at 588 families, with thin and filamentary material handling under B65H close behind at 579.
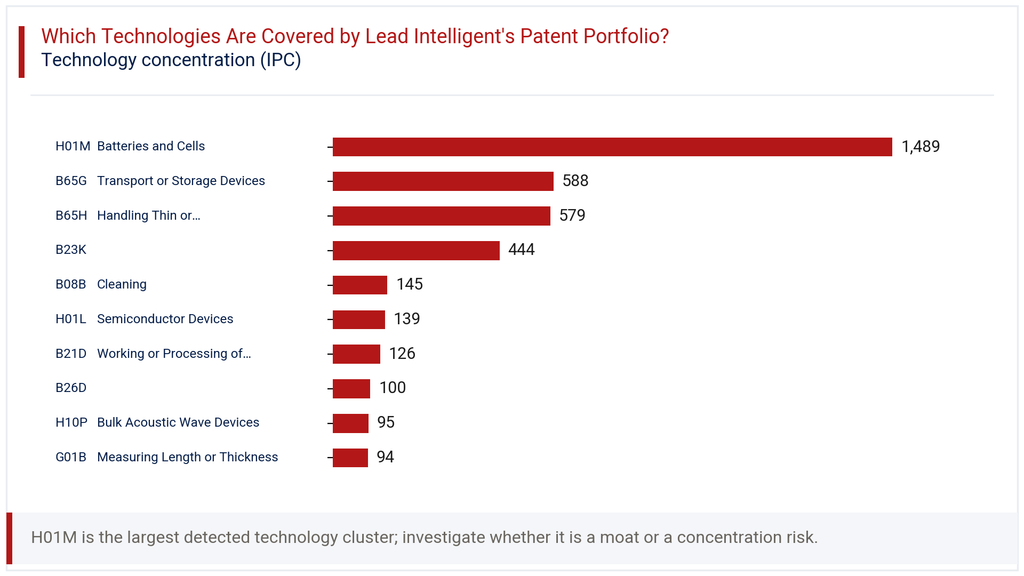
Welding and allied processing technology, B23K, adds 444 families, reflecting precision manufacturing needs in battery assembly lines. Smaller clusters include cleaning equipment (B08B, 145), semiconductor devices (H01L, 139) and sheet metal processing (B21D, 126). This spread shows a portfolio built around the full battery production chain, from material handling to joining and inspection. The technology concentration confirms Lead Intelligent’s equipment-centric identity rather than a diversified or unrelated filing strategy.
How Has the Lead Intelligent Patent Portfolio Evolved Across Filing Geographies?
The heatmap view of filings by year and jurisdiction confirms what the broader data already suggests: China drives almost all volume in every period. Domestic filings rose from 125 in 2016 to a peak of 658 in 2019, mirroring the portfolio’s overall trajectory closely. Even as other jurisdictions appeared, China retained dominant share throughout.
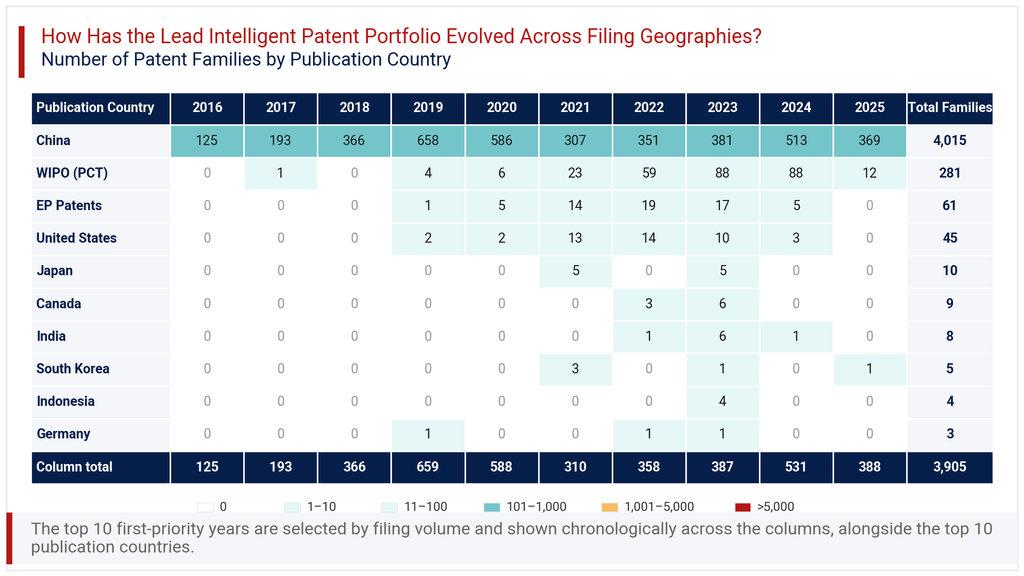
International activity emerged gradually after 2019. WIPO PCT filings rose from single digits to 59 in 2022 and 88 in both 2023 and 2024. European filings peaked at 19 in 2022, while United States filings reached 14 the same year, then declined. Japan, Canada, India and South Korea show scattered, low-volume activity concentrated mainly between 2021 and 2023. This timing lines up with Lead Intelligent’s European headquarters launch in 2021 and its Naila production plant in 2022, suggesting IP filings followed physical expansion rather than preceding it.
Consultant’s Perspective on Lead Intelligent Patent Portfolio
The Lead Intelligent Patent Portfolio reflects a company whose intellectual property strategy tracks its manufacturing growth closely. The heavy China concentration at 98.6% and the utility model preference at 68.5% both point to a domestic-first filing culture common among Chinese industrial equipment makers. This is not unusual, but it does mean that external stakeholders evaluating competitive exposure outside China should look carefully at the thin international coverage.
The battery technology concentration at 39.2% under H01M is the clearest signal in this entire dataset. It confirms where Lead Intelligent’s core engineering investment sits and where competitors are most likely to encounter its protected technology. The gradual uptick in PCT and European filings since 2021 is worth watching, since it may signal a shift toward more deliberate international protection as the company’s European operations mature.
My recommendation for anyone assessing this portfolio commercially: treat the China filings as the foundation of Lead Intelligent’s defensive position, but monitor the next two to three years of WIPO and EP filings closely. That trend will reveal whether international protection becomes a genuine priority or remains a secondary activity tied to specific client contracts like the Northvolt order.
Explore Deeper Insights with Expertlancing Research
This overview only scratches the surface of what a full competitive patent analysis can reveal. Expertlancing Research helps clients go deeper, mapping specific patent families, tracking competitor filing behaviour, and assessing freedom-to-operate risk in target markets. If you are evaluating Lead Intelligent or its peers for investment, partnership, or competitive positioning, our analysts can build a tailored intelligence brief. Reach out to Expertlancing Research to discuss your specific requirements and timelines.