


The Lens Technology Patent Portfolio spans 2,210 patent families, giving a clear view of how this precision manufacturing player protects its technology. An active_rate_pct of 66.6% combines granted and pending filings still in force. Within this, 1,384 families stand granted while 87 remain pending examination. The grant rate sits at 62.6%, a figure worth watching for prosecution efficiency. A combined 739 families fall under lapsed, expired, or revoked status. These numbers reflect prosecution and maintenance outcomes only, not a verdict on patent quality or enforceability.
Filing activity peaked sharply in 2017, when the company filed 509 families in a single year. China dominates as the top jurisdiction, holding 98.0% of filings across 10 jurisdictions tracked. The leading technology cluster is B24B, covering grinding and polishing equipment, with 428 families. This concentration signals where Lens Technology has placed its heaviest engineering and protection bets over the past decade.
This article uses patent filing data to map where Lens Technology has concentrated its research and protection efforts. Filing volume alone does not confirm product success or market leadership. Readers considering specific families for licensing, litigation, or investment decisions should verify details independently before relying on them externally.
About Lens Technology
Company Profile: Lens Technology Co., Ltd. is a Chinese precision manufacturing company that produces glass, ceramic, metal, and sapphire components for consumer electronics and automotive interaction systems. The company was founded in 1993 by Zhou Qunfei and initially manufactured watch glass before expanding into mobile phone cover glass as demand for touchscreen devices grew. Its customers include multinational electronics and automotive manufacturers.
The company’s official site states it follows a “Four new” strategy covering new materials, technologies, equipment, and fields, with business spanning AI-enabled devices, AI servers, and commercial space. It also reports having invested in R&D and production of sapphire materials since 2012, producing sapphire with a purity of 99.999% and Mohs hardness of 9. Lens Technology is listed on the Shenzhen Stock Exchange and completed a secondary listing on the Hong Kong Stock Exchange in 2025. Headquarters remain in Changsha, Hunan.
How Healthy is Lens Technology Patent Portfolio?
Patent portfolio health depends on how filings are distributed across legal status categories. Granted patents account for 62.6% of the total, the single largest share by far. Pending applications add another 3.9%, contributing to the overall active rate of 66.6%. On the other side, expired families make up 15.9%, revoked filings sit at 11.6%, and lapsed cases contribute 6.0%. The composition chart in this section shows this split clearly, with granted and expired status forming the two largest blocks.
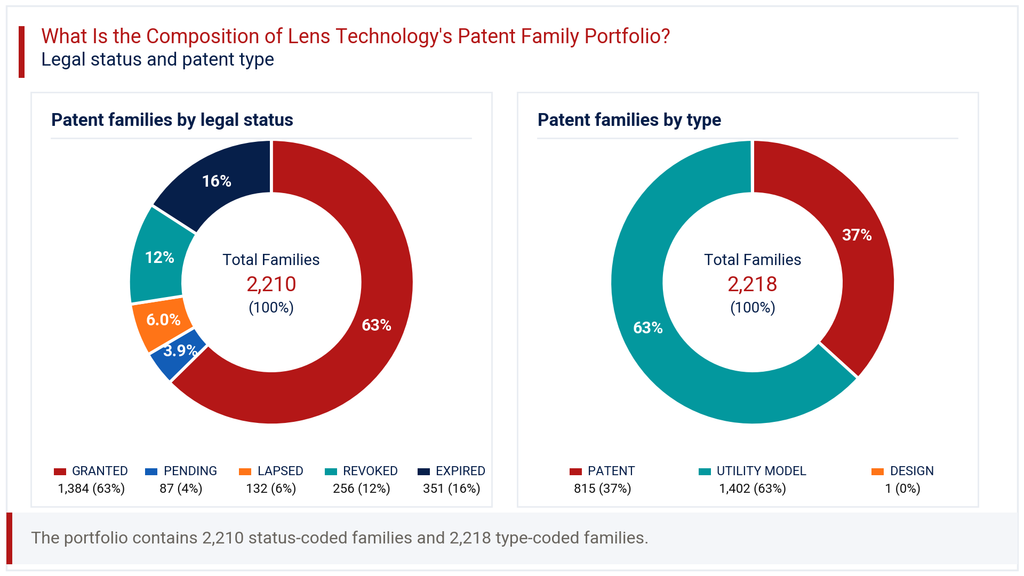
Patent type composition tells an equally important story. Utility models represent 63.2% of filings, well ahead of standard patents at 36.7%. Design filings are negligible at 0.0%. This tilt toward utility models is typical for Chinese manufacturing firms, since utility models offer faster, cheaper protection for incremental engineering improvements. It suggests Lens Technology prioritizes speed and volume of protection over the longer examination cycles typical of invention patents. For a company operating in fast-moving component manufacturing, this approach makes practical sense, though it does mean a smaller share of filings carries the deeper scrutiny associated with full patent examination.
How Has the Lens Technology Patent Portfolio Evolved Over Time?
Patent filing trends at Lens Technology show a distinct growth and consolidation pattern. Filings stayed modest through the early 2010s, with just 19 families in 2012 and 42 in 2013. Growth then accelerated fast: 98 in 2014, 202 in 2015, 355 in 2016, and a peak of 509 in 2017. This four-year run marks the company’s most intensive period of patent activity, likely tied to scaling production and diversifying its material science work.
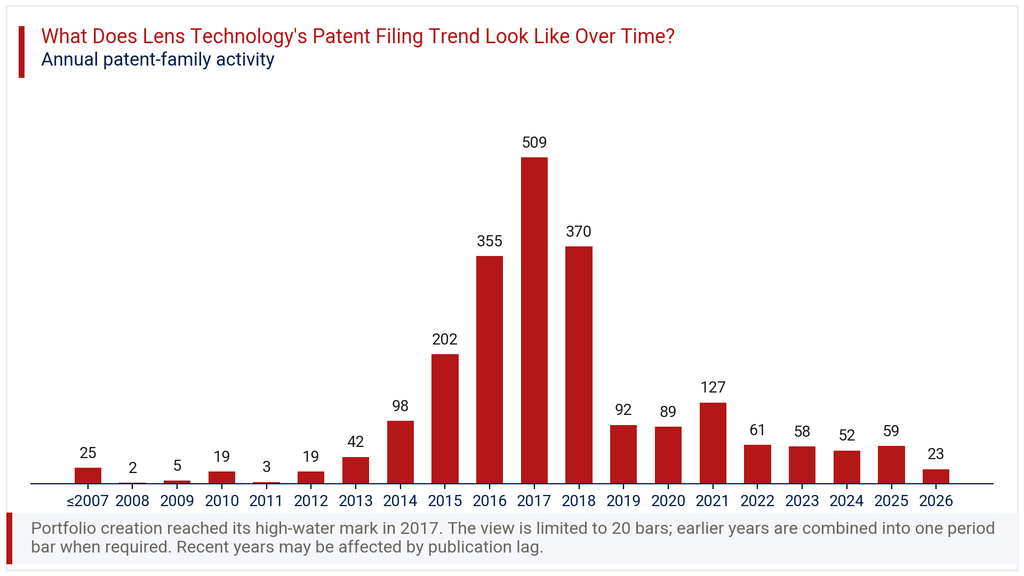
After 2017, filings dropped to 370 in 2018 and fell further to 92 by 2019. The filing-trend chart referenced in this section shows a steadier, lower plateau through the following years, with figures ranging between 52 and 127 annually. The most recent year shows a latest_year_change_pct of -61.0%, but this likely reflects publication lag rather than a genuine pullback in R&D. Patent applications typically take 18 to 24 months to appear in public databases, so 2025 and 2026 figures remain incomplete. The underlying filing trend since 2019 suggests a mature, steady-state protection strategy rather than continued expansion.
Where Does the Lens Technology Patent Portfolio Prioritize Patent Protection?
Patent geography for Lens Technology is heavily concentrated at home. China accounts for 98.0% of all filings, reflecting the company’s manufacturing base and primary customer relationships. The remaining filings spread thinly across nine other jurisdictions. The United States holds 1.7%, followed by WIPO PCT filings at 1.4% and Taiwan at 1.2%. The geographic chart in this section makes this imbalance immediately visible.
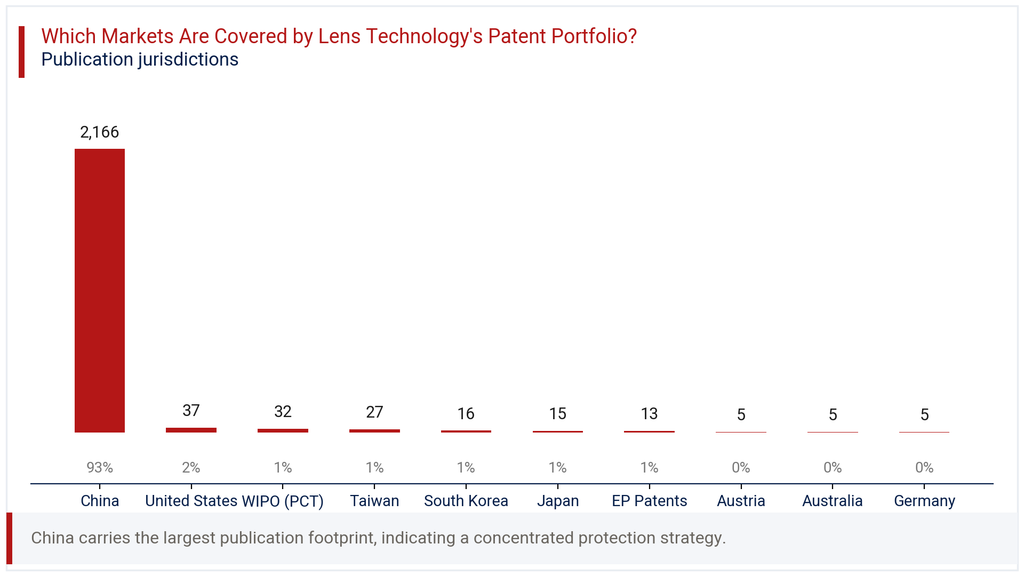
South Korea, Japan, and EP Patents each hold around 0.7% or less, while Austria, Australia, and Germany round out the list at 0.2% each. This pattern indicates Lens Technology’s intellectual property strategy centers on defending its domestic manufacturing position rather than building broad international coverage. For a components supplier serving global electronics brands, this concentration carries some risk. Competitors or counterfeiters operating outside China face fewer patent barriers from this portfolio. Companies evaluating supply chain or licensing relationships with Lens Technology should factor in this limited international filing footprint when assessing protection in non-Chinese markets.
Where is the Lens Technology Patent Portfolio Building Protection Across Key Technologies?
IPC analysis reveals where Lens Technology directs its engineering and protection priorities. The technology chart in this section shows B24B, covering grinding and polishing machinery, as the clear leader with 428 families and a 31.4% share. This aligns naturally with glass and sapphire component manufacturing, where surface finishing is a core process step. Glass composition technology under C03C follows at 13.4%, and glass manufacturing processes under C03B account for 12.3%.
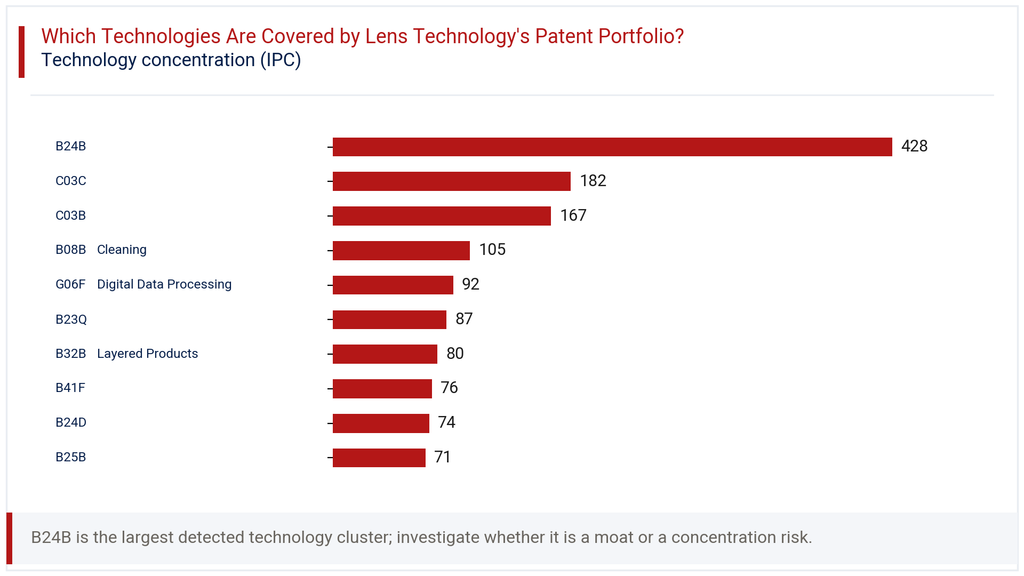
Cleaning technology under B08B holds 7.7%, while digital data processing under G06F contributes 6.8%, a signal of growing software and smart device integration work. Machine tool technology under B23Q adds 6.4%, layered products under B32B reach 5.9%, and printing technology under B41F holds 5.6%. Grinding wheels under B24D and clamping technology under B25B round out the top ten at 5.4% and 5.2% respectively. This spread confirms that core manufacturing processes, particularly surface finishing and glass chemistry, remain the technological backbone of the Lens Technology Patent Portfolio, with digital processing emerging as a secondary growth area.
How Has the Lens Technology Patent Portfolio Evolved Across Filing Geographies?
Year-by-jurisdiction data shows China driving almost all of the growth and decline patterns seen across the full portfolio. Chinese filings rose from 98 in 2014 to 503 in 2017, mirroring the overall peak. They then fell to 91 in 2019 and settled between 57 and 128 annually through subsequent years. The heatmap in this section shows this dominant single-country trend clearly against the thin activity elsewhere.
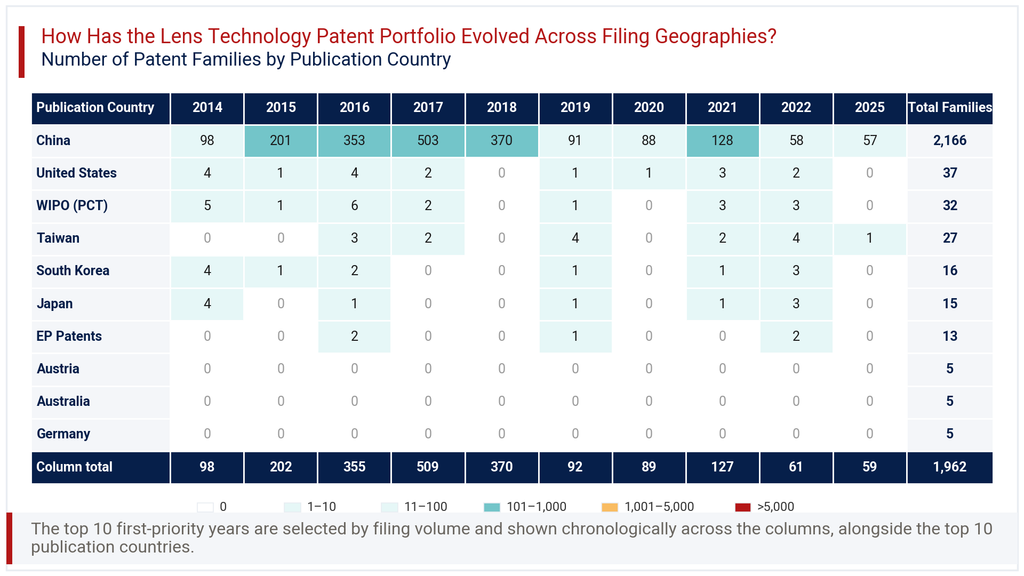
International filings never scaled meaningfully alongside the domestic surge. The United States saw just 4 filings in 2014 and never exceeded 4 in any year shown. WIPO PCT filings peaked at 6 in 2016, while Taiwan, South Korea, and Japan each stayed in low single digits throughout. Austria, Australia, and Germany recorded no filings across the years captured in this matrix. This pattern confirms that even during the 2016-2017 filing surge, Lens Technology did not pursue parallel international protection at scale, leaving its global patent footprint considerably smaller than its domestic one.
Consultant’s Perspective on Lens Technology Patent Portfolio
The Lens Technology Patent Portfolio tells a story of a manufacturing specialist protecting its core processes close to home. The heavy tilt toward utility models and China-based filings reflects a company optimized for speed and domestic market defense rather than global patent dominance. With 62.6% of families granted and 66.6% active, the underlying legal position looks reasonably sound, though the 11.6% revoked share deserves closer scrutiny by anyone assessing portfolio durability.
The concentration in B24B grinding and polishing technology, alongside glass chemistry classes C03C and C03B, confirms where real engineering investment sits. The modest but visible presence in G06F digital data processing hints at the company’s stated ambitions in AI-enabled devices and smart systems, an area worth monitoring for future filing growth.
Looking forward, Lens Technology would benefit from expanding international filings, particularly in the United States, Europe, and South Korea, where its current footprint is thin. As the company pursues AI servers and automotive interaction systems, broader geographic protection will matter more. Investors and partners should track whether post-2025 filings show renewed international ambition or continued domestic focus.
Explore Deeper Insights with Expertlancing Research
This overview only scratches the surface of what the Lens Technology Patent Portfolio reveals. Expertlancing Research helps businesses go deeper, mapping competitive filing patterns, technology white spaces, and licensing risk across any patent portfolio. Whether you are evaluating a supplier, assessing acquisition targets, or benchmarking your own research and development pipeline, our analysts turn raw patent data into decisions you can act on. Reach out to Expertlancing Research to commission a tailored patent intelligence study built around your specific business question.