

The Naura Patent Portfolio offers a useful window into how one of China’s largest semiconductor equipment makers protects its engineering output. Across 6,199 patent families, 87.7% remain active when counting both granted and pending matters together. Of these, 4,278 families have been granted and 1,160 sit pending before patent offices, giving a grant rate of 69.0%. The remaining families, numbering 761 when lapsed, revoked and expired cases are added together, have fallen out of active status. These figures describe prosecution and maintenance outcomes only, not a judgment on patent quality or enforceability.
Filing activity peaked in 2024, when the company filed 682 families, capping a steady climb through the previous decade. China dominates the jurisdiction mix, accounting for 97.7% of all filings across a footprint spanning 10 jurisdictions tracked in this analysis. On the technology side, bulk acoustic wave devices under H10P lead the portfolio with 2,759 families, far ahead of any other classification. This concentration says a great deal about where Naura’s research and engineering investment has gone over the years.
This report reads the Naura Patent Portfolio as a lens on filing behaviour and protection strategy, not as a verdict on commercial outcomes. Patent counts alone do not confirm product success, market share, or a lasting competitive edge in semiconductor equipment. Readers using this analysis for diligence, partnership evaluation, or competitive benchmarking should verify specific families independently. Treat the patterns discussed here as directional business intelligence rather than a substitute for legal or technical due diligence.
About Naura
Company Profile: NAURA Technology Group Co., Ltd is a publicly listed Chinese company that manufactures semiconductor chip production equipment. NAURA Technology Group Co., Ltd is a publicly listed Chinese company that manufactures semiconductor chip production equipment and is currently the largest semiconductor equipment manufacturer in China. According to CINNO Research, in 2024, Naura was the sixth largest semiconductor equipment manufacturer globally in terms of total sales. In 2016, Sevenstar Electronics acquired Beijing North Microelectronics (NMC) from its parent, Beijing Electronics Holdings, and after restructuring the company was renamed NAURA Technology Group in February 2017. In January 2018, the Committee on Foreign Investment in the United States approved Naura’s purchase of Akrion Systems, a Pennsylvania-based supplier of advanced wafer surface preparation technology. The company held its initial public offering on the ChiNext of Shenzhen Stock Exchange on 16 March 2010.
For 2023, the company reported revenue of CN¥22.08 billion and net income of CN¥4.03 billion, with 12,010 employees. Zhao Jinrong serves as Chairman and Tao Haihong as CEO.
How Healthy is Naura Patent Portfolio?
Patent portfolio health starts with legal status, and Naura’s numbers tell a reassuring story. 69.0% of families have secured grants, while 18.7% remain pending before examiners. Together these active categories make up 87.7% of the entire portfolio, a strong share for a company operating primarily in China’s semiconductor equipment space. Lapsed families account for just 1.0%, revoked matters for 6.0%, and expired cases for 5.3%. The composition chart in this section lays out these proportions clearly, showing a portfolio weighted heavily toward live protection.
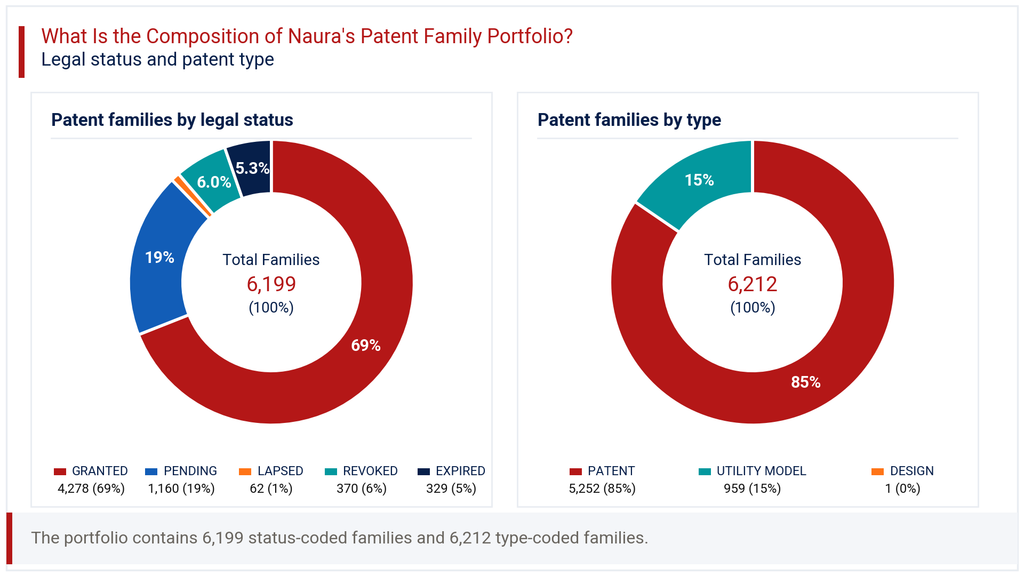
Patent type adds another layer to this picture. Utility patents dominate at 84.5%, with utility models contributing 15.4% and design filings a negligible 0.0%. This mix suggests Naura leans on full-fledged patent protection rather than the shorter, lighter-weight utility model route common among Chinese filers. A low revocation share alongside a solid grant rate points to generally sound drafting and prosecution practice. For a hardware manufacturer competing against global equipment suppliers, this kind of patent legal status profile supports a credible claim to technical ownership across its core process technologies.
How Has the Naura Patent Portfolio Evolved Over Time?
Naura’s patent filing trends show a company that scaled its protection activity considerably after 2019. Filings moved from 308 in that year to 515 in 2020, then climbed further to 533, 597, 651, and 682 across the following four years respectively. The filing-trend chart in this section captures this acceleration, which lines up closely with the company’s growth into one of China’s largest semiconductor equipment suppliers. Earlier years, including a combined 341 families filed before 2008, show a smaller but still meaningful filing base.
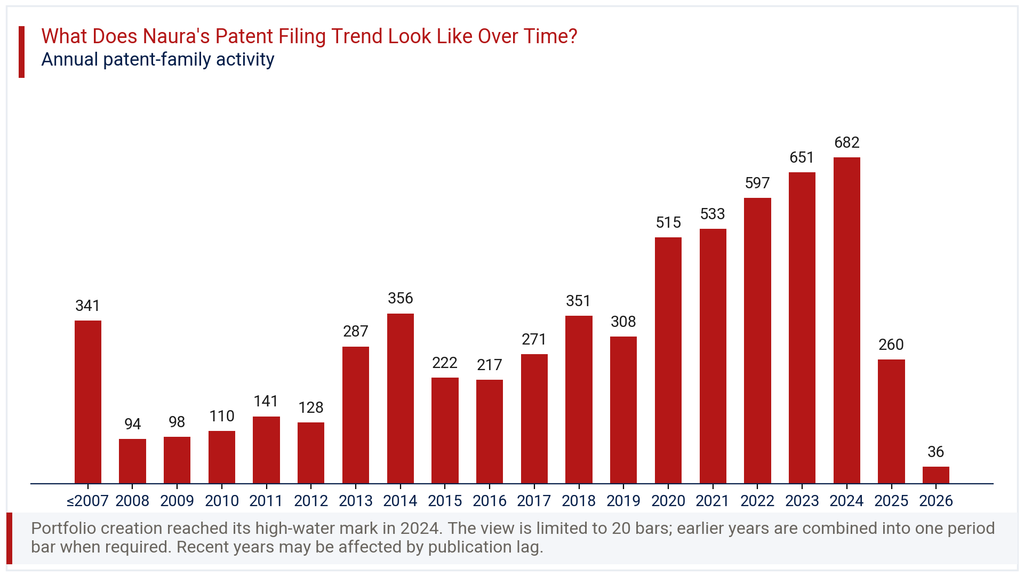
The most recent two years need careful reading. 2025 shows just 260 families and 2026 only 36, reflecting a -86.2% change versus the prior year. This drop almost certainly reflects publication lag rather than an actual pullback in invention activity. Patent applications typically take many months, sometimes years, to appear in public databases after filing. Readers should treat 2025 and 2026 figures as provisional and expect upward revision as records catch up with filing reality.
Where Does the Naura Patent Portfolio Prioritize Patent Protection?
Patent geography within the Naura Patent Portfolio is heavily concentrated at home. China accounts for 97.7% of all filings, a figure that reflects both the company’s domestic manufacturing base and its primary customer relationships with Chinese chipmakers. The geographic chart in this section shows a steep drop after China, with WIPO PCT filings reaching 11.6% and Taiwan following at 10.2%. These two routes likely serve as stepping stones toward broader international filing where warranted.
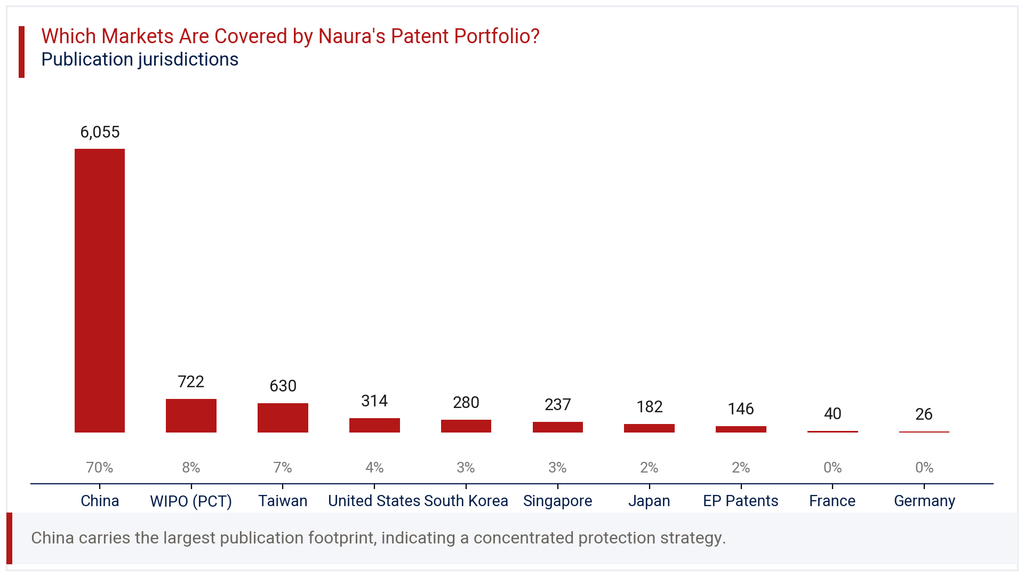
Beyond these, the United States holds 5.1%, South Korea 4.5%, and Singapore 3.8%, each representing meaningful but secondary markets. Japan, at 2.9%, and EP filings at 2.4%, round out a modest presence in advanced semiconductor economies. France and Germany trail with 0.6% and 0.4% respectively. Across 10 jurisdictions total, this pattern suggests a filing strategy built primarily around protecting domestic manufacturing advantage, with selective international filing aimed at markets tied to key customers, suppliers, or competitive threats rather than broad global coverage.
Where is the Naura Patent Portfolio Building Protection Across Key Technologies?
IPC analysis of the Naura Patent Portfolio points to one dominant technology cluster. Bulk acoustic wave devices, classified under H10P, lead with 2,759 families, representing 34.1% of the entire portfolio. The technology chart in this section shows this cluster standing well clear of every other category, signalling a deep and sustained investment in this specific device technology. Coating of metallic materials under C23C follows at 1,408 families, or 17.4%, pointing to strong process-engineering capability around thin-film and surface treatment.
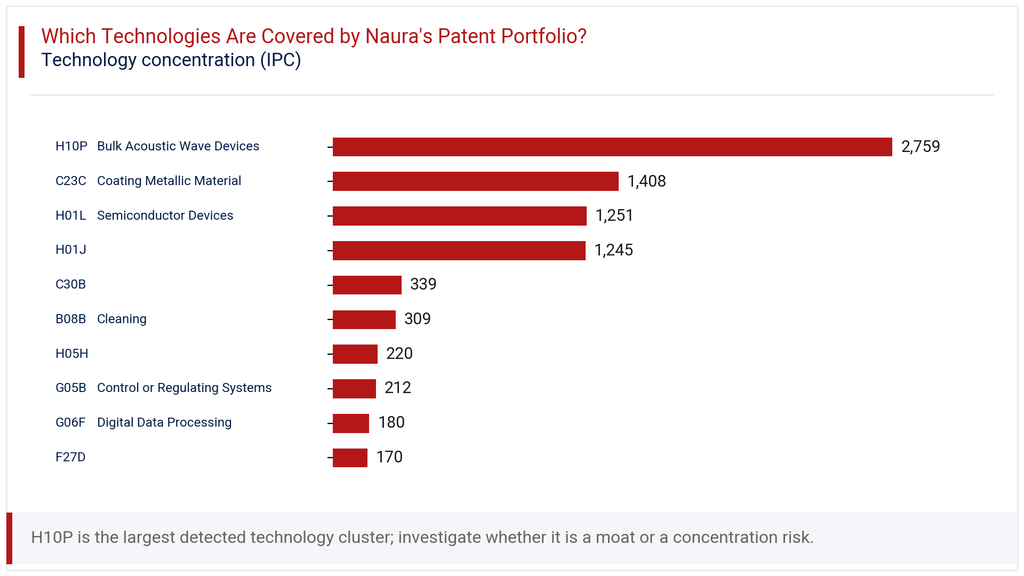
Semiconductor devices under H01L and the related H01J classification each contribute around 15% of filings, at 1,251 and 1,245 families respectively. Together these four categories account for the clear majority of Naura’s technical filing activity. Smaller clusters, including crystal growth under C30B at 4.2% and cleaning technology under B08B at 3.8%, round out a portfolio built around core semiconductor fabrication equipment. This concentration mirrors Naura’s product lines in etching, deposition, and cleaning tools used across chip production.
How Has the Naura Patent Portfolio Evolved Across Filing Geographies?
Viewing filings year by year across jurisdictions reveals how Naura’s international ambitions have grown alongside its domestic base. The heatmap in this section shows China holding the largest volume every year, rising from 288 families in 2013 to 679 in 2024. International filing, however, has grown from a near-standing start. WIPO PCT filings moved from just 25 in 2013 to 121 in 2024, with Taiwan following a similar trajectory, reaching 117 by 2024.
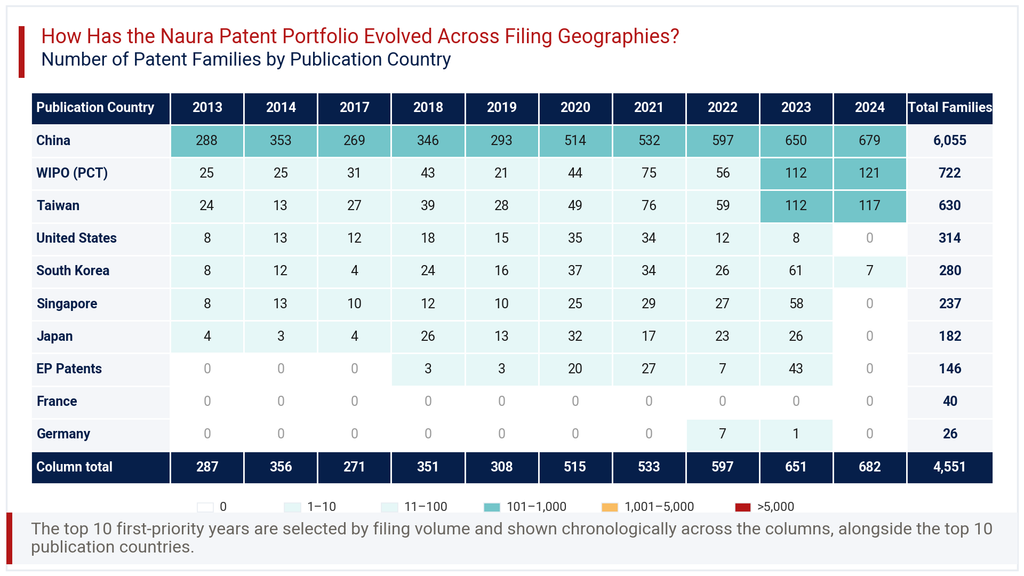
Other jurisdictions show more uneven patterns. United States filings peaked at 35 in 2020 before falling toward zero in 2024, a shift worth watching closely. South Korea and Singapore both saw notable activity in 2023, at 61 and 58 families respectively, before tapering sharply. Japan and EP filings show similar bursts followed by declines. These swings likely reflect shifting customer relationships, licensing considerations, or changing competitive priorities in specific export markets, rather than a uniform international filing policy across years.
Consultant’s Perspective on Naura Patent Portfolio
Reading across all sections, the Naura Patent Portfolio reflects a company whose protection strategy mirrors its manufacturing footprint rather closely. Domestic concentration above 97% is unsurprising for an equipment maker still building its global customer base. The sharp rise in international filings through WIPO and Taiwan since 2020 suggests growing confidence in markets beyond China, even if absolute volumes remain modest against the domestic base of 6,055 families.
The technology concentration in bulk acoustic wave devices, at 34.1% of the entire portfolio, stands out as the single clearest signal of where Naura sees durable competitive advantage. Combined with strong grant rates and low revocation, this suggests a portfolio built on substance rather than volume alone. The declining United States filing trend since 2022 deserves monitoring, particularly given ongoing scrutiny of Chinese semiconductor equipment exports.
My recommendation for anyone assessing Naura commercially is to pair this portfolio analysis with recent litigation and trade-policy tracking. Patent filing patterns alone cannot explain shifts driven by export controls or geopolitical friction. The Naura Patent Portfolio remains a strong proxy for innovation direction, but should sit alongside market and regulatory intelligence for a complete picture.
Explore Deeper Insights with Expertlancing Research
This analysis only scratches the surface of what a detailed patent study can reveal about a company’s technical direction and competitive posture. Expertlancing Research helps clients go further, with family-level validation, competitor benchmarking, and litigation risk screening tailored to specific business questions. If the Naura Patent Portfolio raises questions relevant to your diligence, investment, or technology scouting work, our team can help build the answers. Reach out to discuss a custom research engagement suited to your specific decision timeline.