

The Nexchip Patent Portfolio offers a useful window into how a major Chinese semiconductor foundry builds and defends its technical assets. Across 1911 total patent families, 92.8% remain active when granted and pending cases are combined. Of these, 1593 patents stand granted and 181 remain pending before patent offices. The grant rate sits at 83.4%, a figure that reflects consistent prosecution outcomes. Only 137 families fall into lapsed, expired, or revoked categories combined. These figures describe prosecution and maintenance status only, not a judgment on patent quality or enforceability.
Filing activity tells its own story. The peak filing year was 2025, when Nexchip filed 537 patent families, a sharp rise from earlier years. China dominates as the top jurisdiction, holding 97.1% of filings across 10 jurisdictions worldwide. On the technology side, H01L Semiconductor Devices leads as the top cluster, accounting for 640 families, well ahead of other classifications. This concentration signals where Nexchip channels its research investment most heavily.
This report draws on filing and legal status data to describe patterns rather than predict outcomes. Raw filing counts cannot, by themselves, confirm product success or market advantage over rivals. Readers considering the Nexchip Patent Portfolio for investment, partnership, or competitive assessment should validate specific families independently. Patent counts offer directional insight, but legal and technical due diligence remains essential before any business decision relies on this analysis.
About Nexchip
Company Profile: Nexchip Semiconductor Corporation is a Chinese pure-play semiconductor foundry headquartered in Hefei, Anhui. In May 2015, Nexchip was originally established as a joint venture between Taiwanese company Powerchip and the Hefei City Construction and Investment Holding Group, a state-owned enterprise. Nexchip was founded on the advantages of the local industrial supply chain, driven by BOE Technology to become the world’s leading Display Driver ICs (DDI) chip foundry.
The company engages in research, development, production, and sale of integrated circuit related products, offering display driver chips, CMOS image sensors, microcontrollers, power management, and logic applications products for consumer electronics, smartphones, smart home appliances, security, industrial control, and automotive electronics. In terms of revenue, it is currently mainland China’s third largest semiconductor foundry behind SMIC and Hua Hong Semiconductor, and one of the largest foundries in the world by the same metric.
On 5 May 2023, Nexchip held its initial public offering on the Shanghai Stock Exchange STAR Market, raising 9.96 billion yuan, one of the largest IPOs that year. It is partly owned by Powerchip.
How Healthy is Nexchip Patent Portfolio?
Patent portfolio health depends heavily on legal status distribution, and Nexchip’s numbers look encouraging. Granted patents make up 83.4% of the portfolio, totaling 1593 families. Pending applications add another 9.5%, equal to 181 families still under examination. Combined, the active rate reaches 92.8%, a strong indicator of sustained legal protection. Revoked patents account for 5.8%, or 111 families, while lapsed and expired cases remain minor at 0.2% and 1.2% respectively. The composition chart in this section shows this distribution clearly, with granted patents forming the dominant slice.
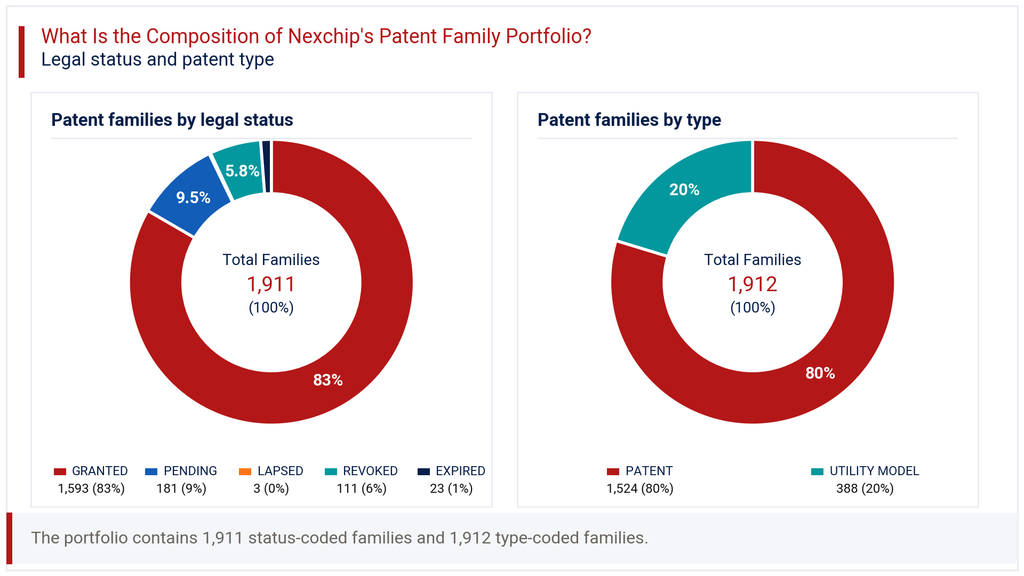
Patent type data adds further texture. Standard patents represent 79.7% of filings, totaling 1524 families, while utility models make up 20.3%, or 388 families. This mix suggests Nexchip pursues stronger, examined protection more often than the shorter utility model route. The low revocation and lapse figures indicate careful portfolio management rather than neglect. For a semiconductor foundry operating in a capital-intensive, technically demanding sector, this balance between active protection and manageable attrition reflects a maturing patent strategy built on real engineering output.
How Has the Nexchip Patent Portfolio Evolved Over Time?
Patent filing trends within the Nexchip Patent Portfolio reveal a company that moved from near dormancy to aggressive filing activity within a decade. Early years through 2017 show minimal activity, with several years recording zero filings. The shift began in 2018 with 22 families, followed by meaningful jumps in 2019 (40) and 2020 (105). Filings then accelerated sharply, reaching 206 in 2022, 336 in 2023, and 326 in 2024. The filing-trend chart in this section captures this steep upward trajectory clearly.
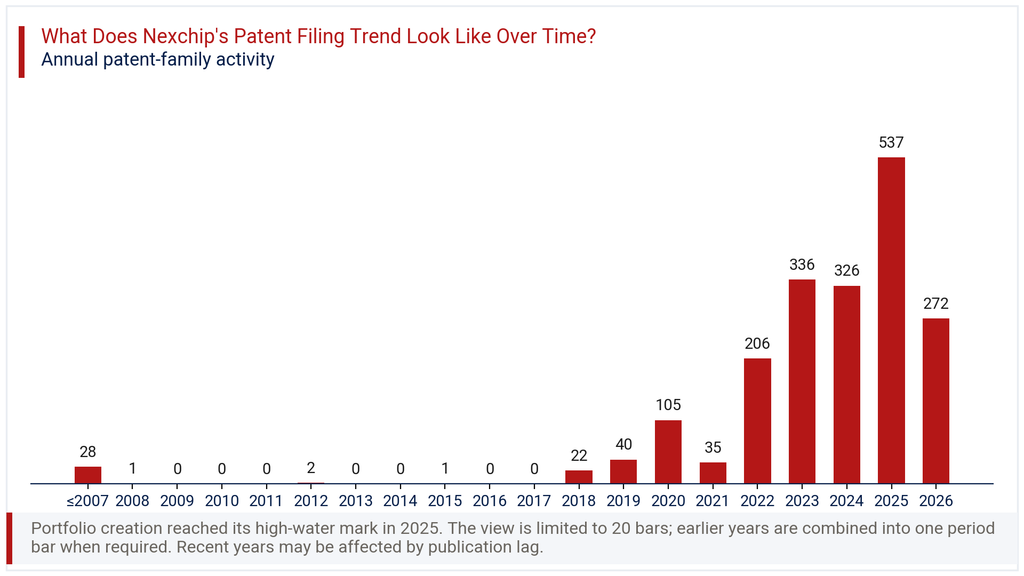
The portfolio reached its peak in 2025 at 537 families, the highest annual count on record. The following year shows 272 families, representing a -49.3% change from the prior year. This drop likely reflects publication lag rather than an actual pullback in filing activity. Patent applications often take twelve to eighteen months to appear in public databases after filing. Readers should treat the most recent one to two years as provisional figures, not evidence of declining research output or shrinking innovation investment at Nexchip.
Where Does the Nexchip Patent Portfolio Prioritize Patent Protection?
Patent geography within the Nexchip Patent Portfolio shows an overwhelming domestic focus. China accounts for 97.1% of all filings, equal to 1855 families. This concentration makes sense given Nexchip’s manufacturing base in Hefei and its primary customer relationships within mainland China. The United States follows at a distant second with 2.6% share, or 49 families. Japan holds 1.8% (35 families), while Taiwan carries 1.3% (24 families), likely connected to the Powerchip joint venture history.
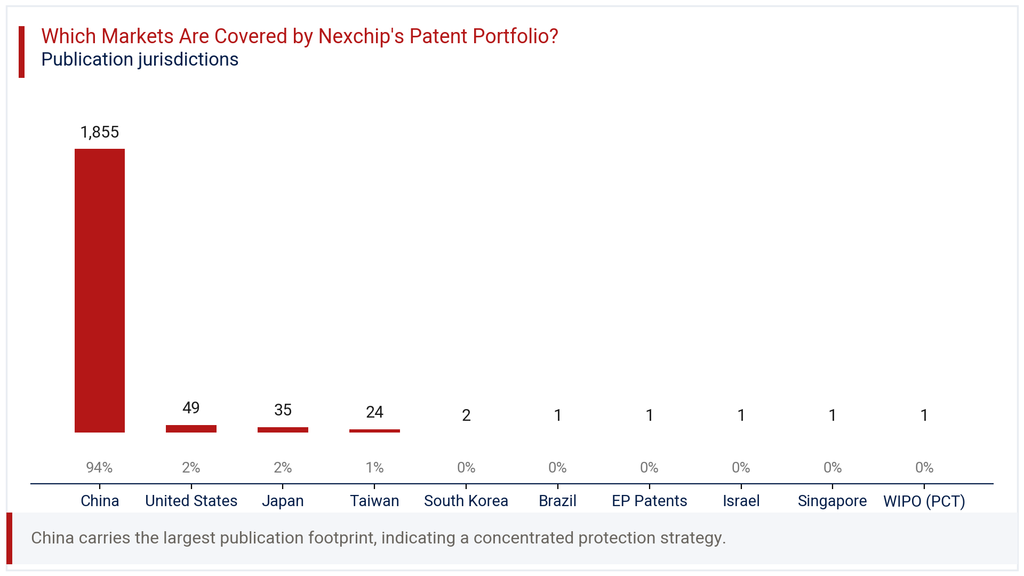
Beyond these four jurisdictions, filings thin out considerably. South Korea, Brazil, the European Patent Office, Israel, Singapore, and the WIPO PCT route each hold just 0.1% of the total. Across all 10 jurisdictions tracked, international filing remains limited. The geographic chart in this section visualizes this heavy domestic tilt plainly. For a foundry whose customer base increasingly includes international smartphone and consumer electronics brands, this narrow geographic footprint may warrant review. Expanding protection into Southeast Asia or Europe could matter as export relationships deepen over coming years.
Where is the Nexchip Patent Portfolio Building Protection Across Key Technologies?
IPC analysis of the Nexchip Patent Portfolio points to a clear technical center of gravity. H01L Semiconductor Devices leads decisively with 640 families, representing 30.2% of the total. This aligns naturally with Nexchip’s core foundry business in display driver and logic chips. H10P Bulk Acoustic Wave Devices ranks second at 15.5% (329 families), followed closely by H10D Semiconductor and Solid-State Devices at 15.0% (318 families).
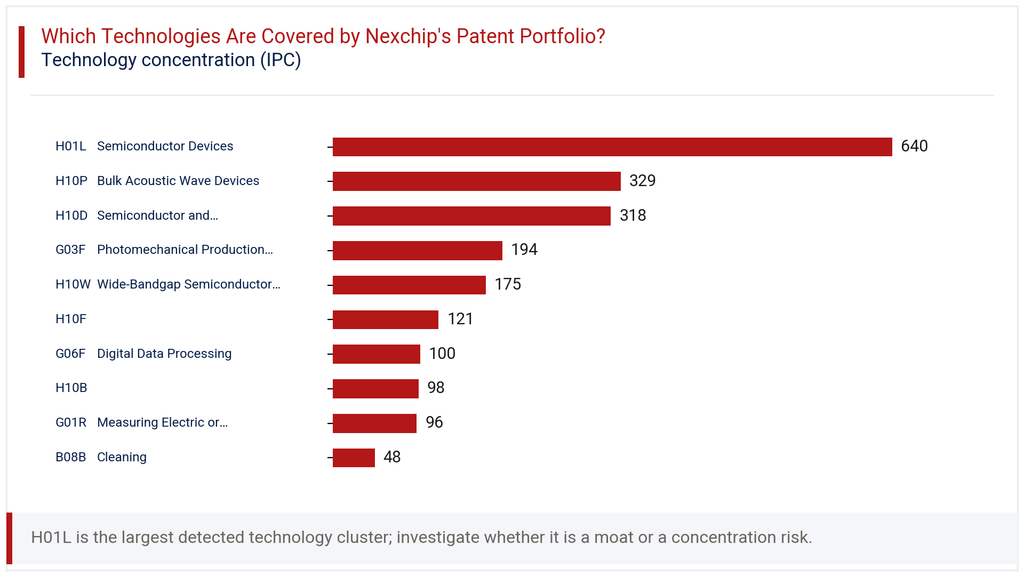
Further down, G03F Photomechanical Production of Patterns holds 9.2% (194 families), relevant to lithography processes central to chip manufacturing. H10W Wide-Bandgap Semiconductor Devices accounts for 8.3% (175 families), signaling investment in power electronics applications. Smaller clusters include H10F at 5.7%, G06F Digital Data Processing at 4.7%, H10B at 4.6%, G01R Measuring Electric or Magnetic Variables at 4.5%, and B08B Cleaning at 2.3%. The technology chart in this section lays out this full distribution. The spread confirms Nexchip’s patent strategy centers tightly on core semiconductor fabrication and measurement technologies.
How Has the Nexchip Patent Portfolio Evolved Across Filing Geographies?
Viewing filing trends by jurisdiction over time reveals how Nexchip’s China focus intensified while other geographies stagnated. In 2018, China recorded 22 families against just 7 from the United States, a relatively balanced early split. By 2020, China jumped to 97 filings while the United States held at 10, already showing diverging paths. The gap widened dramatically afterward.
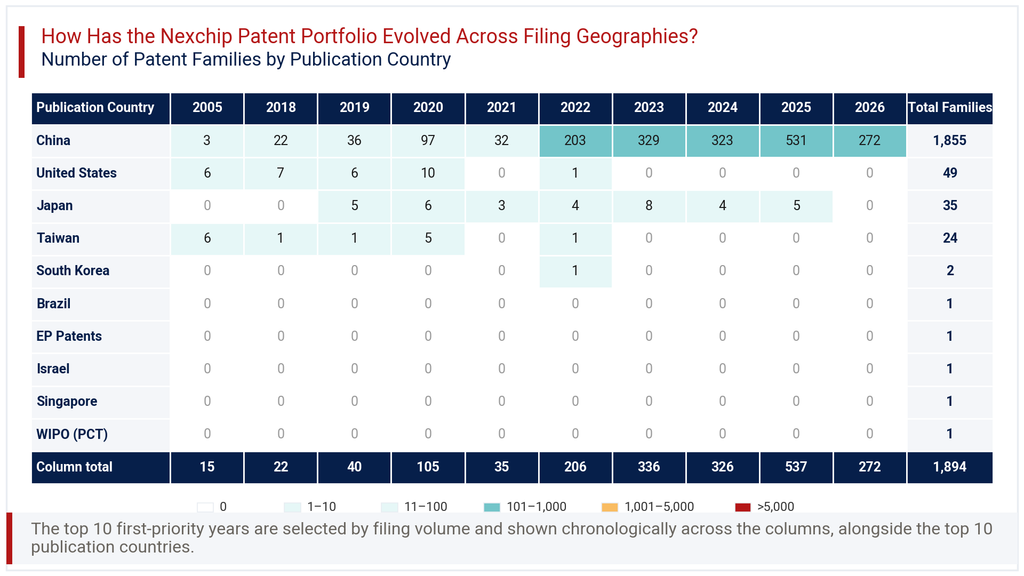
From 2021 onward, international filing nearly disappeared. The United States recorded 0 families in 2021, just 1 in 2022, and nothing since. Japan maintained token activity, filing 3 to 8 families annually through 2025. Taiwan and South Korea show negligible counts across recent years. Meanwhile, China’s filings surged from 203 in 2022 to 531 in 2025. The heatmap in this section makes this divergence unmistakable. Nexchip’s growth story, in patent terms, has become almost entirely a domestic Chinese phenomenon, raising questions about its international protection strategy.
Consultant’s Perspective on Nexchip Patent Portfolio
The Nexchip Patent Portfolio tells a story of rapid, recent, and heavily domestic growth. A company largely inactive in patenting before 2018 has built nearly 1911 families within roughly eight years. The 83.4% grant rate and 92.8% active rate suggest the portfolio holds up well under examination, not merely in volume. Technical focus remains concentrated, with semiconductor devices and bulk acoustic wave technology commanding the largest shares.
The geographic imbalance stands out as the most notable structural gap. With 97.1% of filings in China and negligible activity elsewhere since 2021, Nexchip’s intellectual property protection abroad lags its manufacturing ambitions. Given its position as mainland China’s third largest foundry and its STAR Market listing, international customer relationships will likely grow. Patent protection in the United States, Europe, and Southeast Asia has not kept pace with that trajectory.
Our recommendation: monitor whether Nexchip begins filing internationally through the WIPO PCT route, a channel barely used today. A shift there would signal intent to defend overseas market share rather than rely on domestic protection alone. Until that changes, the portfolio’s reach stays largely confined within China’s borders.
Explore Deeper Insights with Expertlancing Research
Understanding a patent portfolio takes more than reading charts. Expertlancing Research helps technology buyers, investors, and strategy teams interpret filing patterns, legal status shifts, and competitive technology positioning with precision. If the Nexchip Patent Portfolio raises questions about licensing risk, competitive benchmarking, or market entry decisions, our analysts can build a tailored assessment. Reach out to Expertlancing Research for a deeper, customized review suited to your specific business context and decision timeline.