


The Nubia Patent Portfolio spans 11,599 patent families, offering a clear window into how this Chinese smartphone maker protects its technology. Of this total, 35.0% remains active today, a figure covering both granted and pending cases. The portfolio holds 3,870 granted patents alongside 191 pending applications, producing a grant rate of 33.4%. Meanwhile, 7,538 families fall under lapsed, revoked, or expired status combined. These figures reflect prosecution and maintenance outcomes only, not a verdict on patent quality or enforceability.
Filing activity peaked sharply in 2017, when Nubia recorded 2,842 new families in a single year. China dominates the jurisdictional footprint, accounting for 99.5% of all filings across 10 jurisdictions tracked in this analysis. On the technology side, digital data processing under G06F leads every other category, with 4,986 families, making it the single largest cluster in the Nubia Patent Portfolio. These three data points together frame where the company has placed its heaviest bets.
This report draws on filing, status, and classification patterns to describe how Nubia has built its patent position over time. Filing volume alone does not confirm commercial success or a lasting competitive edge in any given market. Readers considering specific families for licensing, litigation risk, or acquisition due diligence should verify those records independently. The analysis that follows is meant to orient strategic thinking, not substitute for case-by-case legal review.
About Nubia
Company Profile: Nubia Technology Co., Ltd. is a Chinese smartphone manufacturer headquartered in Shenzhen, Guangdong. Originally established as a wholly owned subsidiary of ZTE in 2012, it became an independent company in 2015 and received a significant investment from Suning Holdings Group and Suning Commerce Group in 2016. ZTE reduced its stake in Nubia to 49.9% in 2017, meaning Nubia was officially no longer considered a subsidiary of ZTE, but rather an associate company.
In April 2018, Nubia Technology launched a gaming sub-brand, named REDMAGIC. The company markets its smartphones under the nubia brand globally. With headquarters in China, nubia operates around the world including North America, South America, Europe, and Southeast Asia. Nubia introduced the world’s first bezel-less design, along with FiT and TiO fingerprint recognition features. The company focuses heavily on mobile photography and gaming-oriented devices.
How Healthy is Nubia Patent Portfolio?
Patent portfolio health depends heavily on legal status mix, and Nubia’s numbers tell a layered story. Granted patents make up 33.4% of the total, while pending applications add another 1.6%, giving an active rate of 35.0%. Revoked families form the largest single bucket at 52.8%, well above lapsed cases at 12.1% and expired ones at a negligible 0.1%. The composition chart in this section shows this split visually, and the dominance of revoked status stands out immediately against granted and pending shares.
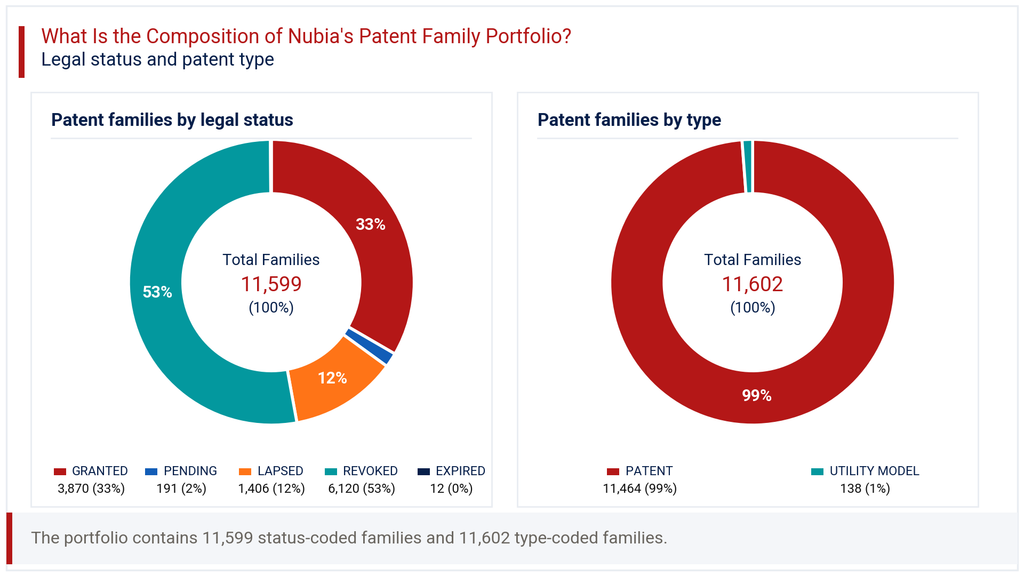
Patent type adds another dimension worth noting. Standard patents account for 98.8% of filings, with utility models forming a small 1.2% share. This heavy tilt toward patents rather than utility models suggests Nubia pursued stronger, more durable protection rather than quicker, lower-bar filings. The high revocation share likely reflects China’s active patent opposition environment and aggressive early filing during the company’s growth years. A portfolio this size, with roughly one-third still active, retains meaningful protection despite the attrition visible in older filings.
How Has the Nubia Patent Portfolio Evolved Over Time?
Patent filing trends for Nubia show a distinct rise, peak, and decline pattern across more than a decade. Filings stayed modest through 2012, with just 30 families recorded that year, before climbing sharply afterward. The real surge began in 2013 with 120 filings, then 2014 jumped to 460, and 2015 reached 1,534. The filing-trend chart in this section captures this acceleration clearly, culminating in the peak year of 2017 at 2,842 families.
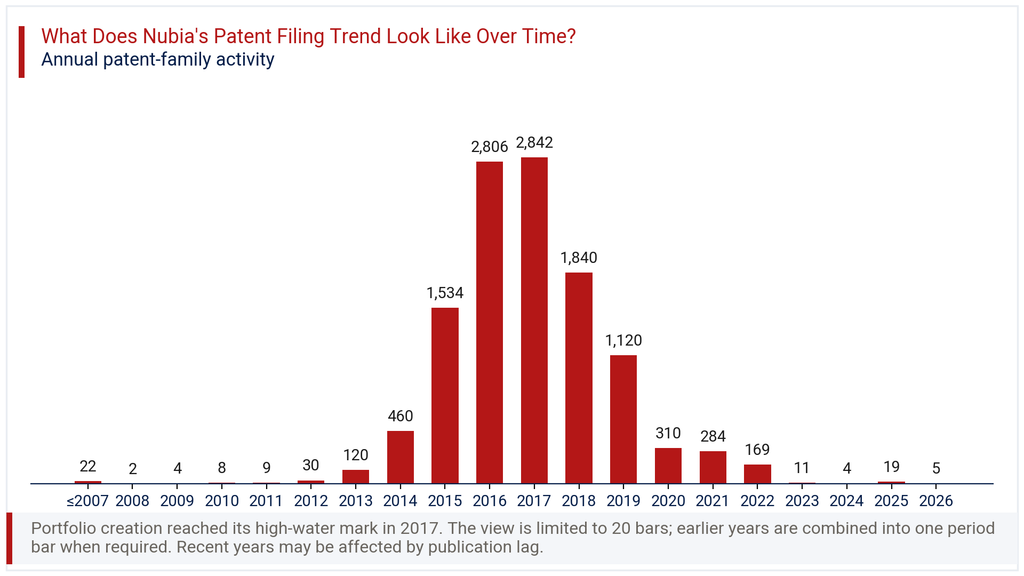
After 2017, volumes declined steadily, falling to 1,840 in 2018 and 1,120 in 2019, then dropping further through 2020 and 2021. By 2022, filings had fallen to 169, and recent years show very low counts, with just 4 families in 2024. The latest year change stands at -73.7%, a steep figure that partly reflects publication lag rather than a genuine halt in filing activity. Patent applications typically take months or years to appear in public records, so the most recent one to two years should be read cautiously. The broader trend still confirms that Nubia’s heaviest innovation investment period ran from roughly 2014 through 2019.
Where Does the Nubia Patent Portfolio Prioritize Patent Protection?
Patent geography within this portfolio reveals an overwhelmingly domestic focus. China alone accounts for 99.5% of all filings, with 11,546 families recorded in that jurisdiction. The geographic chart in this section makes this concentration unmistakable, dwarfing every other country shown. WIPO PCT filings come next at 3.0% share with 353 families, representing Nubia’s main channel for potential international expansion.
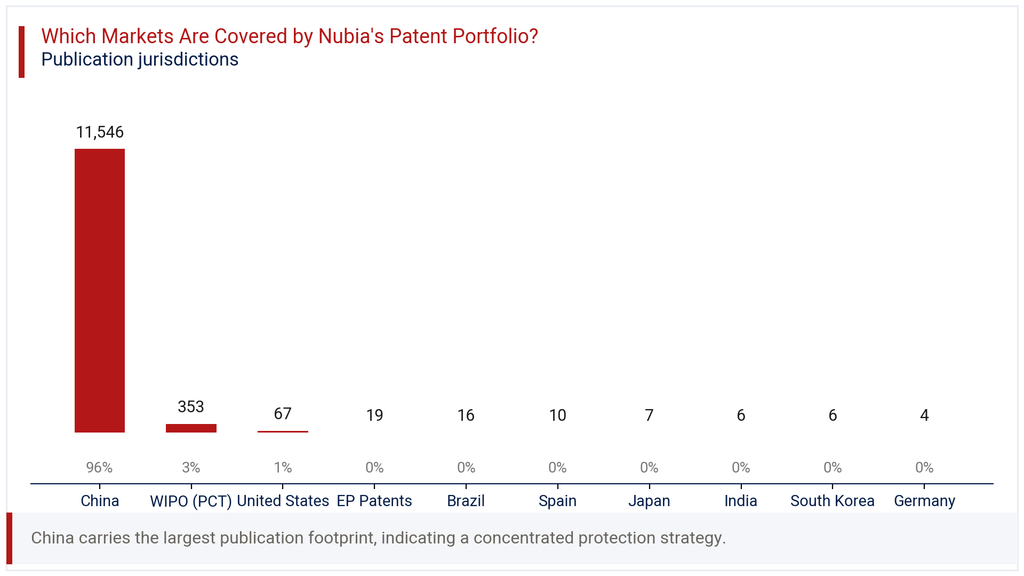
Beyond China and PCT routes, filing presence thins out considerably. The United States holds 67 families, European patents account for 19, and Brazil, Spain, Japan, India, South Korea, and Germany each contribute single-digit to low double-digit counts. This pattern across 10 jurisdictions suggests Nubia built its intellectual property position primarily to defend its home market position. The limited international footprint may reflect business priorities rather than weaker international ambitions, since smartphone competition remains fiercest within China itself. Companies evaluating partnership or licensing opportunities outside China should weigh this concentrated geographic exposure carefully.
Where is the Nubia Patent Portfolio Building Protection Across Key Technologies?
IPC analysis of the Nubia Patent Portfolio points clearly toward computing and communication technologies. Digital data processing under G06F leads with 4,986 families, representing 36.5% of the entire portfolio. Telephonic communication under H04M follows at 22.4% share with 3,064 families, reflecting Nubia’s core smartphone hardware focus. The technology chart in this section lays out this hierarchy, showing a clear drop-off after these two leading categories.
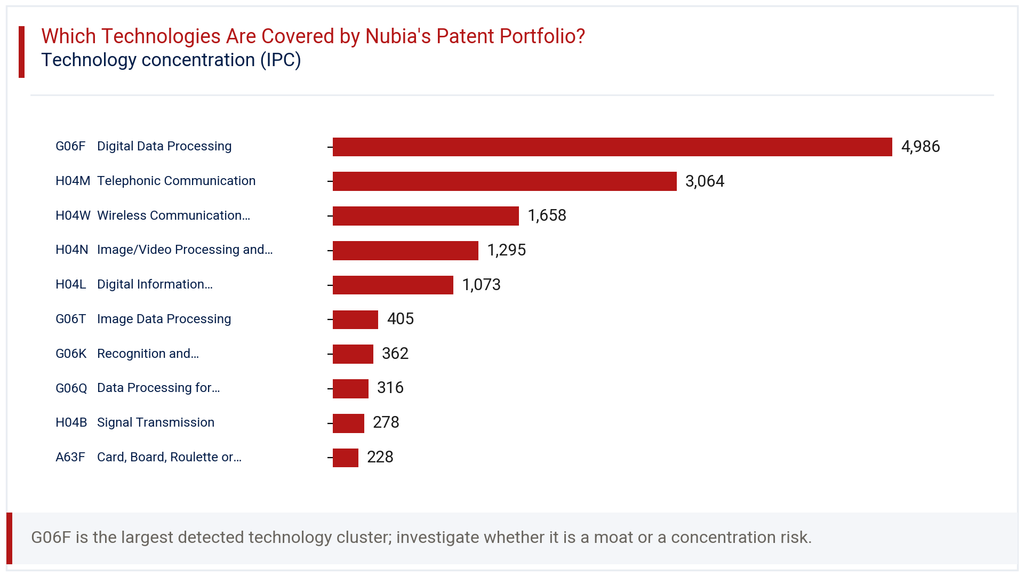
Wireless communication networks under H04W hold 12.1% share with 1,658 families, while image and video processing under H04N contributes 9.5% with 1,295 families. Digital information transmission under H04L adds 7.9% share. Smaller but notable clusters include image data processing, gaming-related classifications under A63F, and recognition technologies under G06K. This spread confirms Nubia’s filing strategy centered on core smartphone functions, imaging capability, and connectivity, with gaming technology emerging as a secondary but deliberate investment area tied to its REDMAGIC sub-brand.
How Has the Nubia Patent Portfolio Evolved Across Filing Geographies?
Examining filings year by year against jurisdiction reveals how closely international activity tracked the domestic filing curve. China’s own filings rose from 118 in 2013 to a peak of 2,832 in 2017, mirroring the portfolio’s overall trajectory. The heatmap in this section shows this parallel movement, with China consistently dominating every year represented.
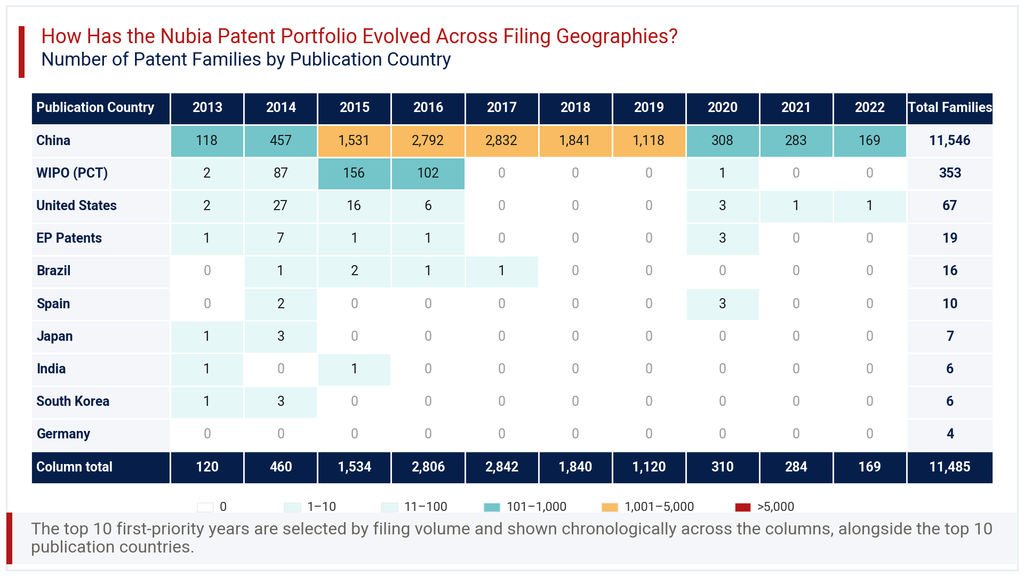
International filing activity, by contrast, appeared only in short bursts. WIPO PCT filings peaked at 156 in 2015, then fell toward zero by 2017 and beyond. United States filings similarly peaked early, reaching 27 in 2014 before declining to single digits. European Patent filings reached just 7 in 2014 and never recovered meaningful volume afterward. This pattern indicates Nubia pursued international protection mainly during its highest growth phase between 2014 and 2016, then pulled back sharply as filing priorities shifted back toward the Chinese market almost entirely.
Consultant’s Perspective on Nubia Patent Portfolio
Looking at the Nubia Patent Portfolio as a whole, three things stand out to me. First, the filing curve tells a classic growth-and-consolidation story, with massive output during 2015 to 2017 followed by a deliberate pullback. Second, the technology concentration in data processing and telephonic communication confirms a portfolio built around core smartphone functionality rather than diversified bets. Third, the near-total reliance on China, at 99.5% of filings, limits the portfolio’s relevance for global licensing or cross-border enforcement conversations.
The high revocation rate, at 52.8%, deserves attention from anyone assessing portfolio strength for investment or partnership purposes. It suggests aggressive early filing followed by significant attrition, common among companies scaling quickly in competitive domestic markets. I would recommend any party evaluating Nubia’s intellectual property position focus specifically on the 3,870 granted and 191 pending families still active, rather than the headline total. Future monitoring should track whether Nubia resumes meaningful filing volume or continues operating with a smaller, more selective patent strategy going forward.
Explore Deeper Insights with Expertlancing Research
This overview only scratches the surface of what the Nubia Patent Portfolio can reveal about competitive positioning and technology direction. Expertlancing Research helps clients go further, with family-level validation, competitor benchmarking, and custom technology mapping tailored to specific business questions. Whether you are assessing licensing opportunities, tracking a competitor, or building an investment thesis, our analysts can turn this data into decision-ready intelligence. Reach out to discuss how we can support your next patent research project.