


OFILM’s patent portfolio spans 2,956 patent families, offering a window into the company’s technology investments over two decades. The active rate stands at 29.4%, covering both granted and pending families still in force. Within this, 809 families have been granted and 61 remain pending before patent offices worldwide. The grant rate across the portfolio comes to 27.4%, while lapsed, expired, and revoked families together account for a much larger share, totalling 2,086 families. These figures reflect prosecution and maintenance outcomes only, not a verdict on patent quality or enforceability.
Filing activity peaked in 2020, when OFILM filed 668 patent families, the single busiest year in its history. China dominates as the top jurisdiction, holding 91.2% of filings, with the portfolio spread across 10 jurisdictions globally. On the technology side, optical elements and instruments under G02B (Optical Elements, Systems and Instruments) lead the pack with 816 families, underlining OFILM’s core strength in optoelectronics.
This report draws on patent filing and legal status records to map where OFILM has concentrated its research effort and protection strategy. Filing counts alone do not confirm product success, market dominance, or technical superiority over competitors. Readers considering business decisions based on this analysis should independently verify specific patent families before relying on them externally. The intent here is to offer directional insight, not a substitute for formal due diligence or legal opinion.
About OFILM
Company Profile: OFILM Group Co., Ltd. is a Shenzhen-based manufacturer of optoelectronic components and smart devices. Ofilm Group is one of the world’s largest advanced high-technology manufacturing and assembly companies. OFILM began to operate formally in August 2002 and listed on the Shenzhen Stock Exchange in August 2010 with stock code 002456. Its products and technologies help smartphones, safer vehicles, and smart wearable devices reach billions of users globally. The company employs nearly 20,000 workers worldwide, with manufacturing and R&D locations in Silicon Valley, mainland China, Taiwan, Japan, Korea, and Israel. OFILM maintains long-term strategic partnerships with leading technology and consumer electronics companies globally.
The company remains entrepreneur-led, founded by Rongjun Tsai, a Kodak-trained optical engineer. OFILM has filed 6,596 patents worldwide and holds 3,572 granted patents. It was recognized as a National Intellectual Property Demonstration Enterprise in 2018.
How Healthy is OFILM Patent Portfolio?
Patent portfolio health depends heavily on legal status composition, and here OFILM’s numbers tell a cautionary story. Lapsed families make up 58.3% of the total, the single largest category by far. Granted families stand at 27.4%, pending applications at 2.1%, while revoked and expired families add 6.0% and 6.3% respectively. The composition chart in this section shows how thinly the active share is spread against the lapsed majority.
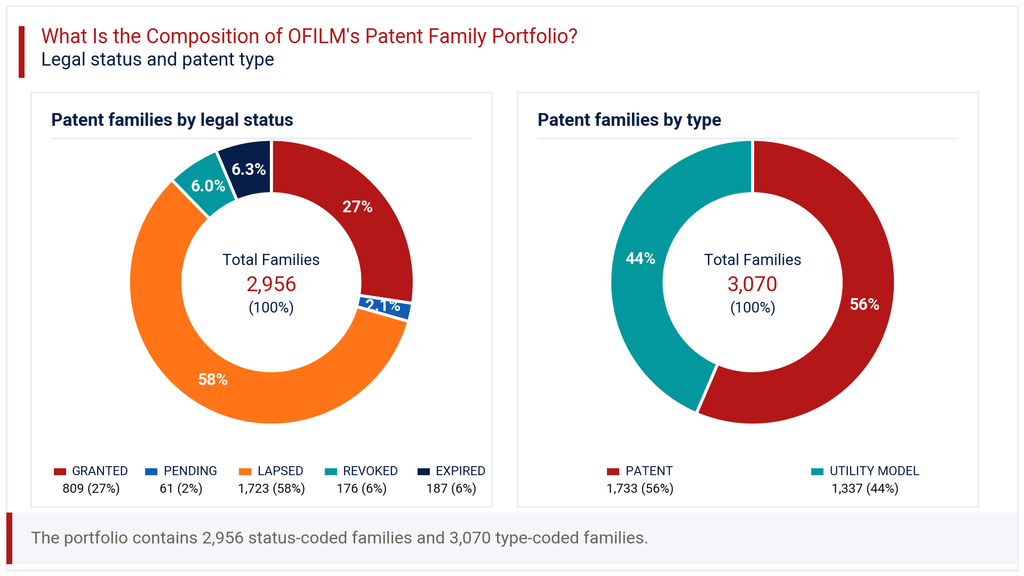
A lapsed-heavy profile usually points to maintenance fee lapses or deliberate abandonment of lower-priority filings. On patent type, the split between Patent (56.4%) and Utility Model (43.6%) filings is fairly balanced. Utility models, common in China, offer faster but shorter protection terms, which may explain part of the lapse pattern. For a company of OFILM’s filing volume, this legal status mix suggests a portfolio built more for speed and volume than long-term asset retention. Buyers or partners evaluating licensing opportunities should look closely at which specific families remain active before assuming broad coverage.
How Has the OFILM Patent Portfolio Evolved Over Time?
OFILM’s patent filing trends show a steep climb through the 2010s, followed by a pronounced late-cycle slowdown. Filings were modest through 2011 (just 4 families), then rose sharply from 2012 (37) onward. The portfolio hit multiple high points: 438 in 2017, 343 in 2019, and a peak of 668 in 2020. The filing-trend chart in this section traces this rise and the subsequent pullback clearly.
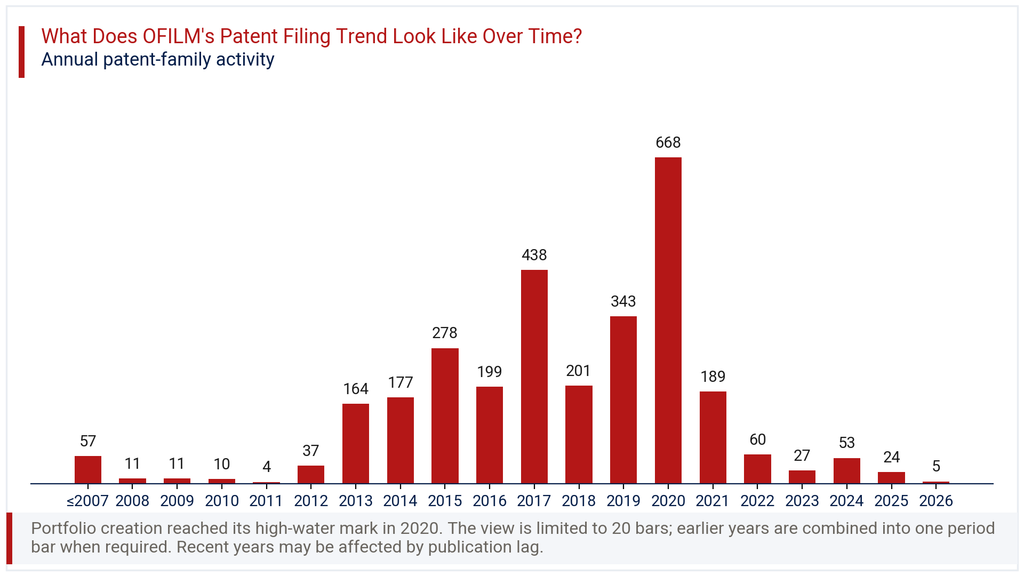
After 2020, filings dropped substantially, falling to 189 in 2021 and further to 60 in 2022. The most recent year’s change reflects a decline of 79.2%, a figure that looks dramatic but needs context. Patent applications typically take 18 to 24 months to publish, so 2024 and 2025 figures understate actual filing activity. Rather than reading these later years as a genuine retreat from innovation, treat them as incomplete data awaiting publication. The real trend will only become clear once these cohorts finish their publication cycle.
Where Does the OFILM Patent Portfolio Prioritize Patent Protection?
Patent geography for OFILM is heavily concentrated in its home market. China accounts for 91.2% of all filings, reflecting the company’s manufacturing base and primary commercial footprint. The next largest jurisdiction, WIPO’s PCT route, carries 11.1% of filings, used typically as a stepping stone toward multiple national phases. The United States follows at 9.1%, with Japan at 7.2%. The geographic chart in this section lays out this concentration at a glance.
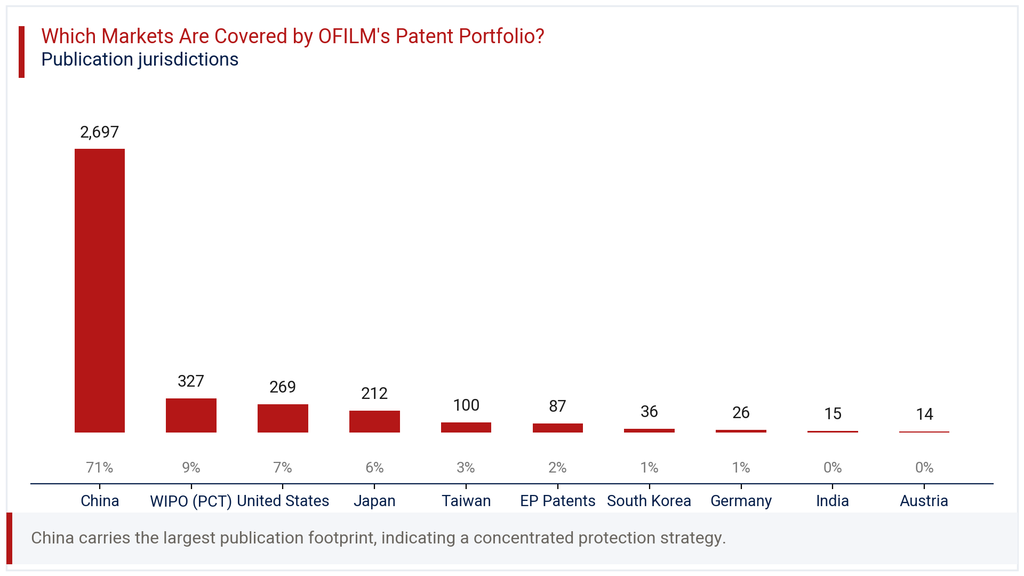
Smaller but still notable shares appear in Taiwan (3.4%), EP Patents (2.9%), and South Korea (1.2%), with Germany, India, and Austria each under 1%. This pattern suggests OFILM protects its core technology domestically first, then selectively extends coverage to markets tied to its customer base, such as the US and Japan. The limited spread into Europe and India points to a filing strategy prioritizing manufacturing and supply chain jurisdictions over broader global enforcement. Companies partnering with OFILM outside China should check whether equivalent protection exists locally before assuming coverage.
Where is the OFILM Patent Portfolio Building Protection Across Key Technologies?
IPC analysis of OFILM’s portfolio reveals a clear anchor in optical technology. G02B (Optical Elements, Systems and Instruments) leads with 816 families, or 24.0% of the total, consistent with OFILM’s optoelectronic component business. Close behind sits G06F (Digital Data Processing) at 670 families (19.7%), and G06K (Recognition and Presentation of Data) at 646 families (19.0%). The technology chart in this section shows these three categories forming the backbone of the portfolio.
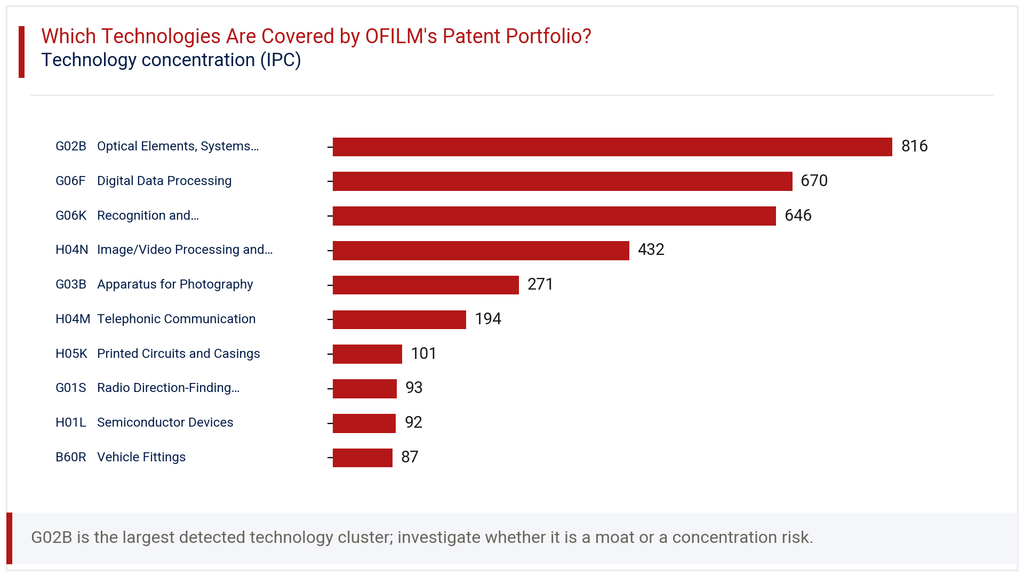
Imaging and display technology also feature prominently, with H04N (Image/Video Processing and Display) at 432 families (12.7%) and G03B (Apparatus for Photography) at 271 families (8.0%). Smaller clusters include H04M (Telephonic Communication) at 194 families and H05K (Printed Circuits and Casings) at 101 families. This spread shows OFILM building protection around camera modules, image sensors, and data recognition systems, all core to smartphone and vehicle camera supply chains. The relatively smaller presence in semiconductor devices (H01L, 2.7%) suggests component-level innovation sits outside the primary focus area.
How Has the OFILM Patent Portfolio Evolved Across Filing Geographies?
Looking at filing activity by year and jurisdiction together adds useful texture to the patent geography story. China’s filings tracked the overall portfolio trend closely, rising from 42 in 2012 to a peak of 523 in 2020. The heatmap in this section shows how China consistently dominated every filing year in the dataset. WIPO PCT filings, by contrast, stayed negligible until 2019 (52) and 2020 (156), suggesting a later push toward international filing routes.
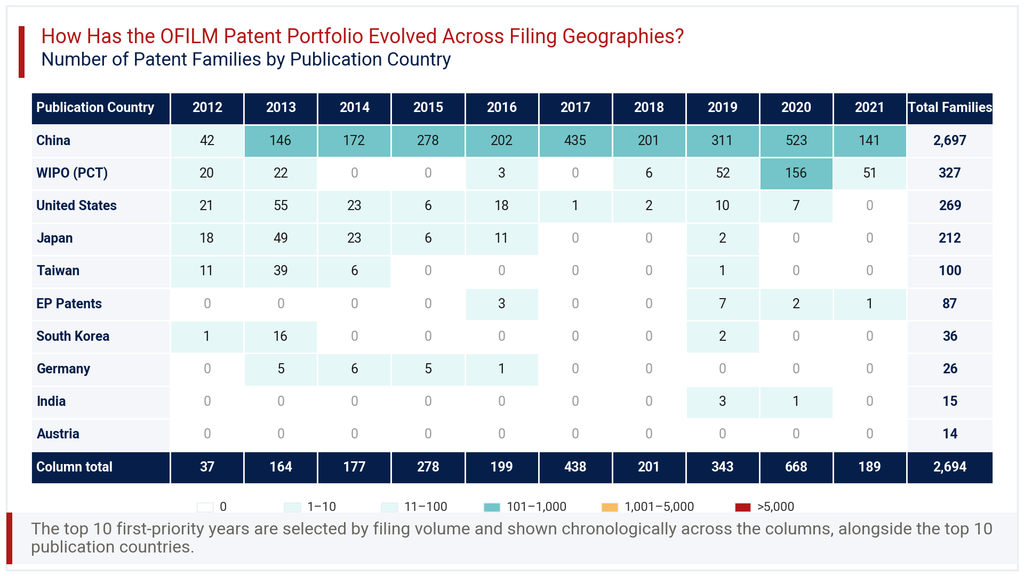
The United States and Japan both saw filing activity concentrated earlier, peaking around 2013 with 55 and 49 families respectively, then tapering off sharply after 2016. Taiwan and South Korea show a similar early-then-fading pattern, with little to no activity after 2014. This timeline suggests OFILM’s international filing strategy shifted over the decade, from direct national filings in the US, Japan, and Taiwan toward PCT-based filing by 2019 and 2020. The shift indicates a more deliberate, centrally managed approach to global patent strategy in later years.
Consultant’s Perspective on OFILM Patent Portfolio
Taken as a whole, the OFILM patent portfolio reflects a company that scaled its filing output rapidly to match its manufacturing growth, then pulled back as priorities shifted. The heavy concentration in China (91.2%) and the dominance of optical and imaging technologies align well with OFILM’s known business in camera modules and optoelectronic components. The lapsed share of 58.3% warrants attention though, since it signals that a large portion of historical filings no longer carry active protection.
For partners or acquirers evaluating OFILM, the practical question is not filing volume but which specific families remain enforceable in which markets. The shift toward PCT filings after 2019 suggests a more considered international strategy is emerging, worth monitoring in coming filing cycles. Given publication lag affects 2024 and 2025 data, any assessment of recent OFILM patent portfolio momentum should wait for fuller data before drawing firm conclusions. Technology clusters in optics, data processing, and recognition systems remain the strongest assets worth closer legal and technical review. A targeted family-by-family audit would serve any serious commercial evaluation far better than aggregate counts alone.
Explore Deeper Insights with Expertlancing Research
This overview only scratches the surface of what OFILM’s patent filings reveal about its technology priorities and market strategy. Expertlancing Research helps clients go deeper, validating specific patent families, benchmarking against competitors, and assessing freedom-to-operate risks. Whether you are evaluating a partnership, acquisition, or competitive threat, our analysts can build a tailored patent intelligence study around your specific questions. Reach out to Expertlancing Research to turn this directional view into a decision-ready analysis.