

The Pegatron Patent Portfolio spans 2,955 patent families, offering a window into how this Taiwanese electronics major protects its engineering output. Of these families, 62.2% remain active today, a figure that combines granted assets still in force with applications still pending examination. The portfolio holds 1,541 granted patents alongside 296 pending applications, translating into a grant rate of 52.1%. The remaining families, totalling 1,118 (lapsed, expired and revoked combined), have exited active protection. These figures describe prosecution and maintenance status only; they are not a verdict on patent quality or enforceability.
Filing activity peaked in 2009, when Pegatron filed 289 families, marking the busiest year across the entire dataset. Taiwan stands out as the dominant jurisdiction, accounting for 71.1% of filings, with the portfolio spread across 10 jurisdictions worldwide. On the technology side, G06F Digital Data Processing leads all IPC classes with 950 families, confirming computing hardware as the company’s central engineering focus.
This article reads the Pegatron Patent Portfolio as a business signal, not a legal opinion. Filing volume alone cannot confirm commercial success, product uptake or competitive strength in any single technology area. Readers evaluating specific families for licensing, diligence or litigation purposes should verify details against primary patent office records. What follows is a structured read of legal status, filing trends, geography and technology concentration, intended to support that evaluation rather than replace it.
About Pegatron
Company Profile: Pegatron Corporation is a Taiwanese electronics manufacturer based in Taipei. Pegatron Corporation is a Taiwanese electronics manufacturer specializing in developing and producing computing, communications, and consumer electronics for major brands. The company also designs and manufactures computer peripherals and components.
Pegatron’s primary products include laptops, desktop computers, netbooks, game consoles, handheld and mobile devices, motherboards, video cards, and LCD TVs. It also produces broadband communication devices, smartphones and set top boxes for global brand clients. The company was founded on June 27, 2007, and T.H. Tung serves as Chairman. Its subsidiaries include ASRock and Unihan Corporation. Pegatron reported revenue of US$40.357 billion and net income of US$505 million in 2023.
The company serves customers worldwide across computing, communications and consumer electronics segments, operating as one of Taiwan’s major contract electronics manufacturers.
How Healthy is Pegatron Patent Portfolio?
Patent portfolio health starts with legal status, and here the Pegatron Patent Portfolio shows a reasonably stable picture. Granted patents make up 52.1% of all families, while pending applications contribute another 10.0%, giving an active rate of 62.2%. Lapsed families account for 29.8% of the total, a sizeable share that typically reflects deliberate non-renewal rather than rejection. Revoked families sit at just 1.5%, and expired ones at 6.6%, both modest shares. The composition chart in this section lays out this split clearly across all five status categories.
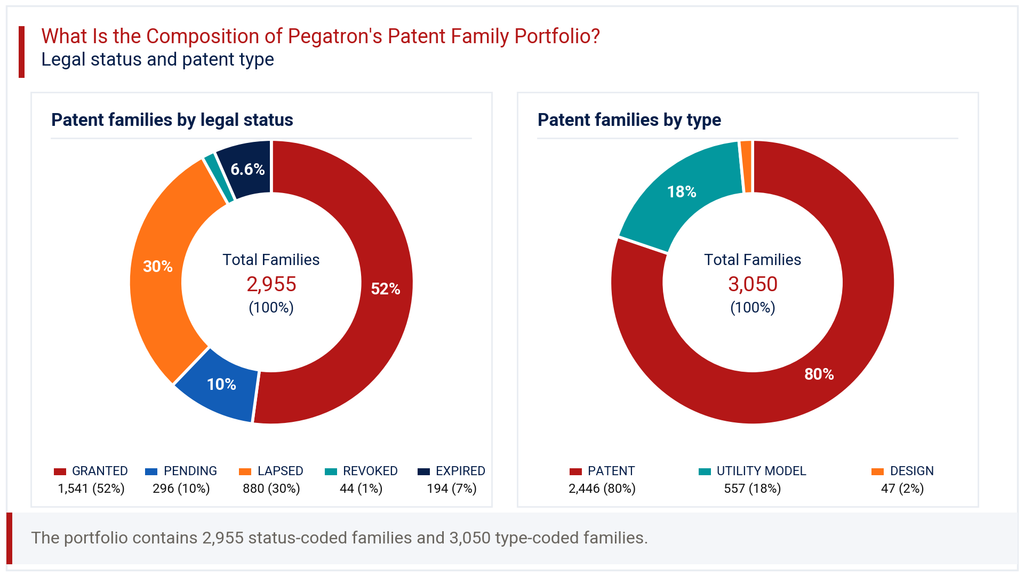
Looking at patent type, utility patents dominate at 80.2% of the portfolio, with utility models at 18.3% and design rights at a small 1.5%. This mix suggests Pegatron leans heavily on full patent protection rather than the faster, shorter-term utility model route common in Asian filing strategies. The relatively high lapsed share, nearly three in ten families, points to active portfolio pruning, where Pegatron is likely retiring older or lower-value assets rather than maintaining filings indefinitely. For a diversified contract manufacturer with thousands of components across product lines, this kind of selective maintenance is a reasonable way to control legal costs while keeping the strongest assets alive.
How Has the Pegatron Patent Portfolio Evolved Over Time?
Patent filing trends across the Pegatron Patent Portfolio reveal a clear arc shaped by the company’s own corporate history. Filings before 2007 totalled 149, rising sharply to 254 in 2008 and peaking at 289 in 2009, shortly after the company’s 2007 founding. The filing-trend chart in this section shows a steady decline through the early 2010s, bottoming at 79 in 2015, before a partial recovery that carried filings back up to 192 in 2018.
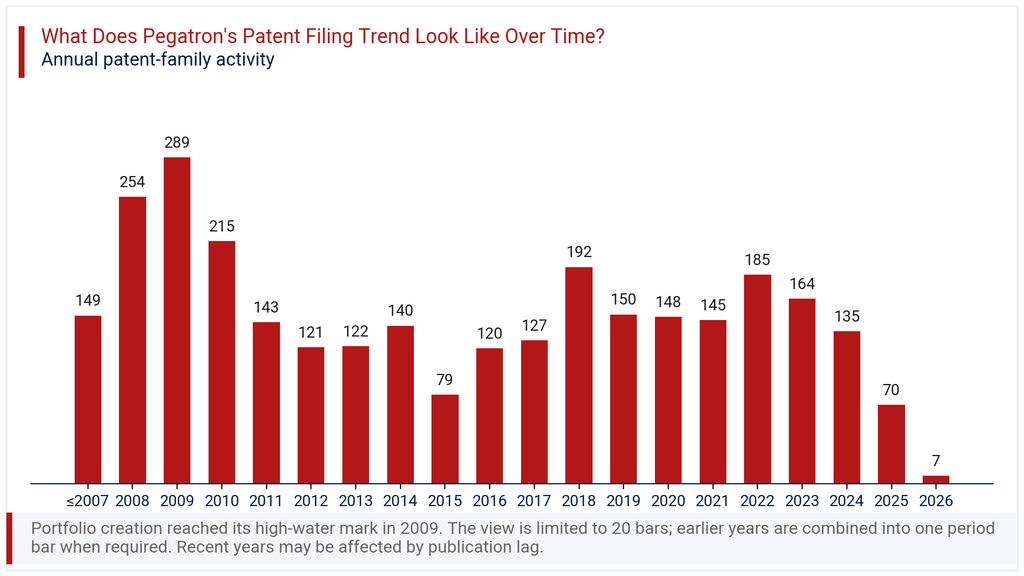
Since 2018, yearly filings have hovered between 135 and 185, suggesting a maturing filing rhythm rather than aggressive expansion. The sharp drop visible in 2025 (70 families) and 2026 (7 families) reflects a 90.0% decline, per the latest year-on-year change, but this should be read cautiously. Patent applications typically take 12 to 24 months to publish, so recent years are structurally under-counted in any live dataset. Rather than signalling a real pullback in R&D output, the last two years most likely reflect publication lag working its way through the pipeline.
Where Does the Pegatron Patent Portfolio Prioritize Patent Protection?
Patent geography within the Pegatron Patent Portfolio points firmly toward home-market protection. Taiwan leads with 2,101 families, representing 71.1% of the entire portfolio, consistent with Pegatron’s headquarters and primary manufacturing base. China follows at 1,575 families (53.3%), reflecting the scale of production and assembly operations across the mainland. The United States ranks third with 879 families (29.7%), a meaningful share given the importance of US brand clients and end markets for contract manufacturers.
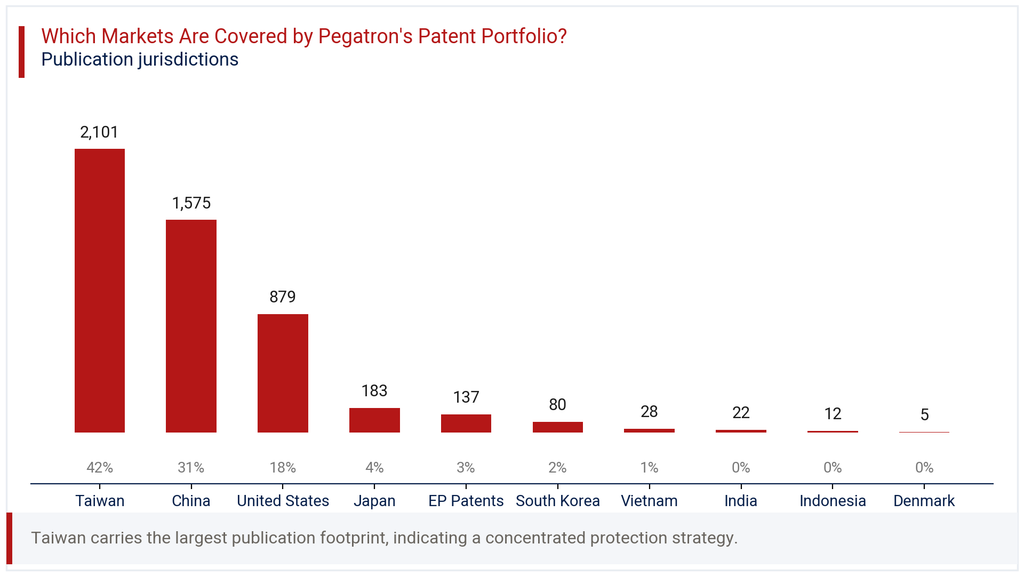
Beyond these three anchor markets, filing volumes drop considerably. Japan holds 183 families (6.2%), while EP Patents account for 137 families (4.6%). South Korea, Vietnam, India, Indonesia and Denmark each contribute smaller shares, none exceeding 2.7%. The geographic chart in this section makes this concentration visually obvious. This pattern indicates that Pegatron prioritizes jurisdictions tied directly to manufacturing footprint and major customer demand, rather than pursuing broad global filing coverage. For a contract manufacturer, this is a sensible cost-to-value trade-off, since defensive filing in low-volume markets rarely justifies the expense.
Where is the Pegatron Patent Portfolio Building Protection Across Key Technologies?
IPC analysis of the Pegatron Patent Portfolio confirms computing hardware as its single largest technology concentration. G06F Digital Data Processing leads with 950 families, representing 36.9% of the portfolio, far ahead of any other class. H05K Printed Circuits and Casings ranks second at 651 families (25.3%), reflecting deep investment in the physical assembly and packaging side of electronics manufacturing. Together, these two classes account for well over half the portfolio’s technology focus.
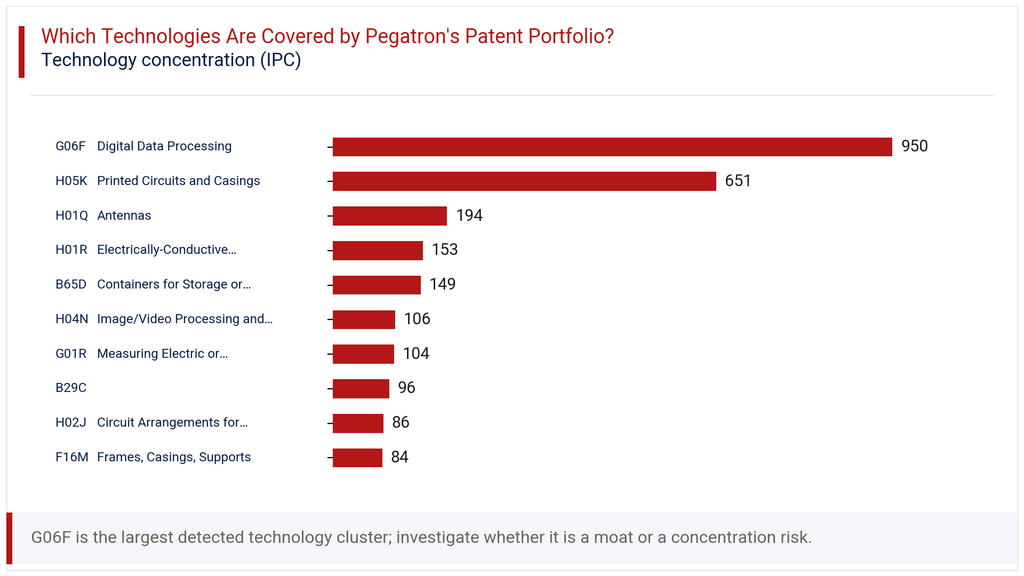
The technology chart in this section also shows meaningful activity in H01Q Antennas (194 families, 7.5%) and H01R Electrically-Conductive Connections (153 families, 5.9%), both consistent with communications hardware and connector engineering. B65D Containers for Storage or Transport holds 149 families (5.8%), a less obvious category that likely reflects packaging innovation tied to logistics. Smaller clusters in imaging, measurement, power circuits and structural frames round out the picture. Collectively, this spread suggests Pegatron’s engineering investment tracks its actual manufacturing portfolio, computing devices, circuit assembly and connectivity hardware, rather than speculative or unrelated technology bets.
How Has the Pegatron Patent Portfolio Evolved Across Filing Geographies?
Viewed year by year, the Pegatron Patent Portfolio shows how jurisdiction priorities have shifted since the company’s founding. Taiwan and China both filed heavily in 2008 and 2009, with China at 129 and 151 families respectively, nearly matching Taiwan’s own volumes during those peak years. The heatmap in this section shows China’s filings cooling notably after 2019, falling to just 34 families by 2023, a marked pullback from its earlier highs.
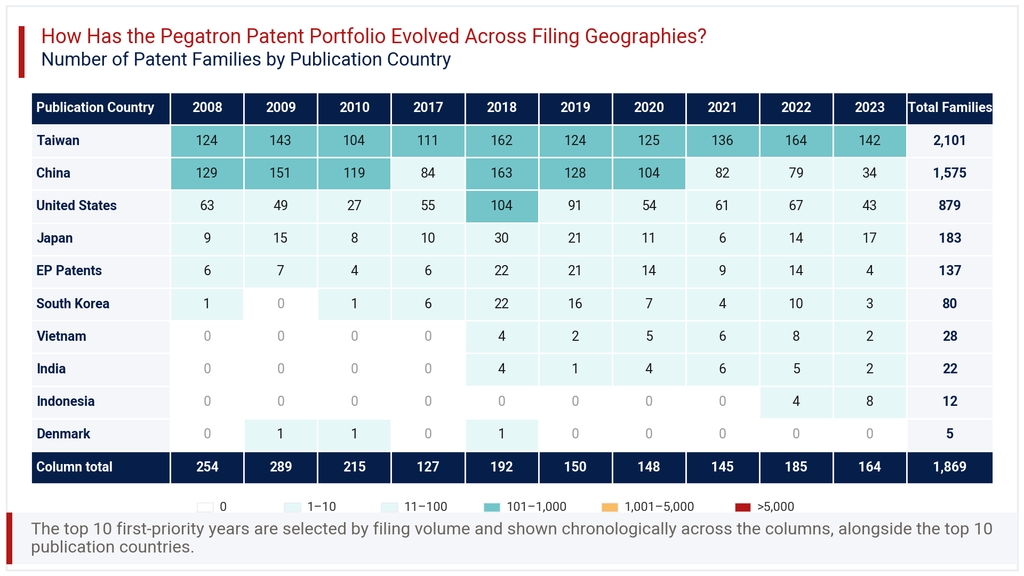
Taiwan, by contrast, has stayed remarkably consistent, filing between 104 and 164 families most years through 2023. The United States shows a distinct spike in 2018 (104 families), coinciding with broader portfolio growth that year across nearly every jurisdiction. Smaller markets like Vietnam, India and Indonesia show filings only emerging from 2018 onward, suggesting these are newer additions to Pegatron’s geographic strategy rather than long-standing priorities. This evolving mix indicates a portfolio that has gradually diversified beyond its original Taiwan-China core, even as those two markets remain foundational.
Consultant’s Perspective on Pegatron Patent Portfolio
The Pegatron Patent Portfolio reads as a disciplined, manufacturing-aligned filing program rather than a speculative or defensive stockpile. The heavy concentration in computing hardware and printed circuit technology mirrors Pegatron’s actual product lines, which is exactly what one would expect from a contract manufacturer serving major global brands. The 62.2% active rate, combined with a meaningful lapsed share, suggests a portfolio that gets pruned rather than left to accumulate indefinitely.
Three points merit attention going forward. First, the steep decline in China filings after 2019 deserves a closer look, whether it reflects strategic re-prioritization toward Taiwan and the US, or changing cost dynamics in Chinese patent prosecution. Second, the recent dip in 2025 and 2026 filings is almost certainly a publication-lag artefact, not a genuine slowdown, and should be re-checked against updated records in a year or two. Third, smaller emerging markets like India, Vietnam and Indonesia show early but real filing activity, worth monitoring as potential signals of shifting manufacturing geography. Overall, this is a portfolio built for operational relevance rather than aggressive IP monetization, a sensible posture for a company in Pegatron’s business model.
Explore Deeper Insights with Expertlancing Research
This analysis only scratches the surface of what the Pegatron Patent Portfolio can reveal about competitive positioning and technology direction. Expertlancing Research helps clients go further, mapping specific patent families against competitor filings, licensing opportunities and emerging technology clusters. Whether you are assessing acquisition targets, benchmarking R&D investment or preparing freedom-to-operate analysis, our team can build the detailed intelligence you need. Reach out to Expertlancing Research to commission a custom patent study tailored to your business questions.