


The Piotech Patent Portfolio offers a window into how one of China’s key semiconductor equipment makers protects its process technology. Across 1,733 patent families, 88.5% remain active, covering both granted and pending cases. Of these, 790 have been granted and 744 are still pending, giving a grant rate of 45.6%. The remaining families fall into lapsed, expired or revoked status, totalling 199 cases. These figures describe prosecution and maintenance outcomes only, not a judgment on patent quality or enforceability.
Filing activity peaked sharply in 2025 with 398 families filed that year, following a multi-year climb from single digits a decade earlier. China dominates jurisdictional coverage with a 99.5% share, while the portfolio spans 9 jurisdictions in total. The leading technology cluster is C23C, Coating of Metallic Material, accounting for 858 families, making it by far the most heavily protected area within the Piotech Patent Portfolio.
This report is meant to help readers interpret filing patterns, not to draw conclusions about commercial success or market standing on its own. Patent counts reflect filing behaviour and legal process, not product adoption or revenue impact. Readers evaluating specific technology areas or competitive positioning should validate individual families before using them in external analysis or decision-making.
About Piotech
Company Profile: Piotech, Inc. is a Chinese semiconductor equipment manufacturer headquartered in Shenyang. Founded in April 2010, Piotech is a nationally recognized high-tech enterprise engaged in research, production, sales and technical services for semiconductor capital equipment. The company has three main product lines, including PECVD, ALD and SACVD equipment, with self-developed intellectual properties reaching advanced global performance levels.
These products serve integrated circuit manufacturing, TSV packaging, optical waveguide and Micro-OLED display applications. Piotech equipment has been installed in more than 60 IC device production lines across over 20 regions, including Beijing, Shanghai, Wuhan, Hefei, Tianjin and Taiwan. The company has established subsidiaries in Beijing, Shanghai, Haining, Shenyang and the United States, and became publicly traded in April 2022. It has been rated a National Intellectual Property Excellence Enterprise for 2019-2022. According to Wikipedia, the China Integrated Circuit Industry Investment Fund remains its largest shareholder.
How Healthy is Piotech Patent Portfolio?
Patent portfolio health depends on how many families remain legally active versus how many have lapsed or been withdrawn. The composition chart in this section shows 790 granted families and 744 pending ones, together forming an active rate of 88.5%. Only 10 families have lapsed and 80 have expired, while 109 have been revoked. This pattern signals a portfolio still largely in motion, with examination outcomes yet to settle for a sizeable share of filings.
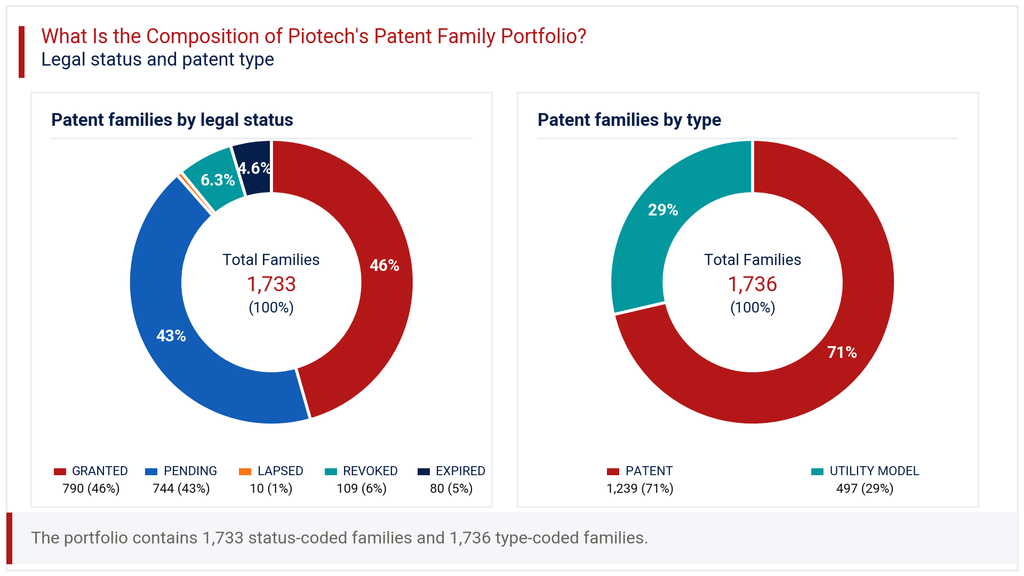
The grant rate of 45.6% is reasonable for a company filing at this pace, especially given how many applications remain pending. On patent type, 71.4% of families are standard patents while 28.6% are utility models, a split common among Chinese equipment manufacturers. Utility models offer faster protection with a shorter examination cycle, useful for incremental engineering improvements. The relatively low revocation share, at 6.3%, suggests that most challenged filings have not resulted in significant attrition. Taken together, the legal status profile points to a portfolio that is actively being built rather than one in decline or consolidation.
How Has the Piotech Patent Portfolio Evolved Over Time?
Patent filing trends for Piotech show a long quiet period followed by a steep acceleration. Filings stayed in single or low double digits from 2010 through 2019, aside from a notable spike of 86 families in 2015. From 2020 onward, volumes rose sharply: 62 in 2020, 108 in 2021, 205 in 2022, 318 in 2023, and 388 in 2024. The filing-trend chart in this section captures this inflection clearly.
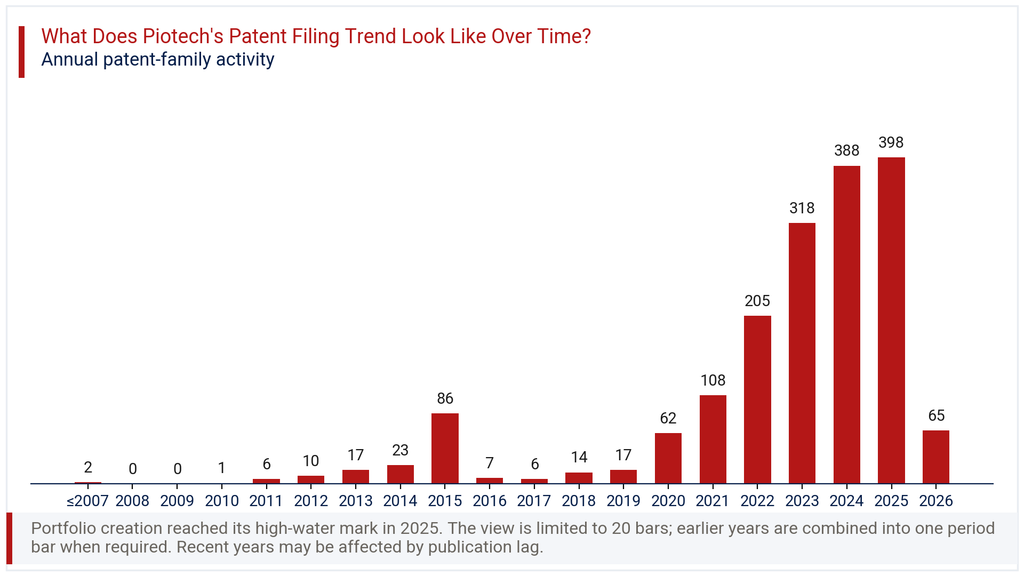
The year 2025 recorded the highest count at 398 families, suggesting continued investment in protecting process innovations. The apparent drop in 2026, down 83.7% from the prior year’s pace, should not be read as a real slowdown. Patent applications typically take many months to appear in public databases, so recent filing years are almost always undercounted at the time of reporting. The broader five-year trend, from 2020 to 2025, shows sustained and compounding filing growth. This trajectory aligns with Piotech’s expansion in production line installations and its 2022 public listing, both of which typically coincide with heavier R&D documentation.
Where Does the Piotech Patent Portfolio Prioritize Patent Protection?
Patent geography within this portfolio is heavily concentrated in a single market. China accounts for 99.5% of all filings, underscoring Piotech’s primary focus on protecting innovation within its domestic manufacturing base. The geographic chart in this section shows a steep drop-off after China, with WIPO PCT filings at 4.4% and Taiwan at 3.4%.
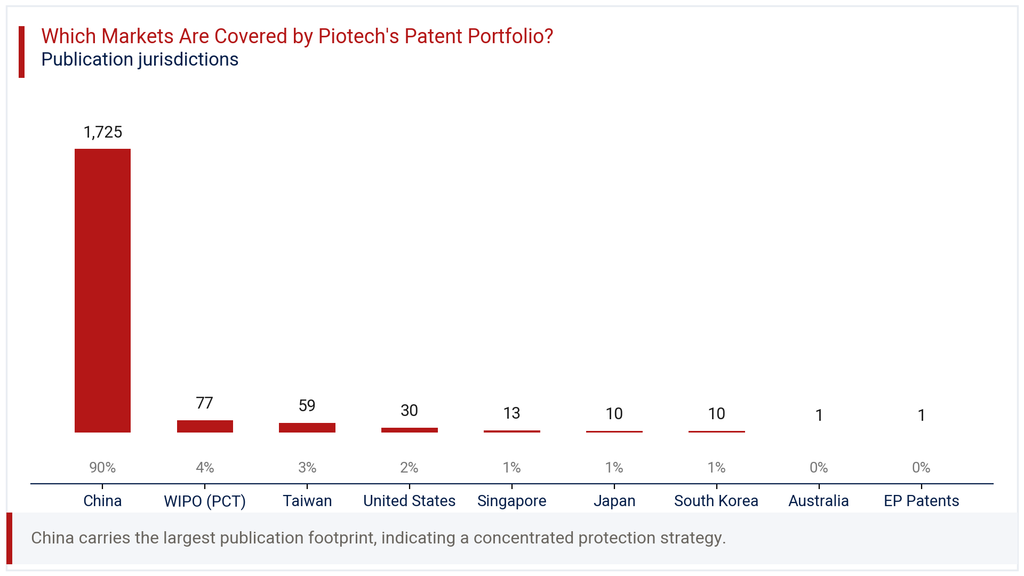
Beyond these, the United States holds 1.7% of filings, while Singapore, Japan and South Korea each register under 1%. Australia and EP Patents each account for just 0.1%, reflecting minimal direct filing activity in those regions. This distribution suggests that Piotech has historically prioritized securing its home market position before building out international coverage. The use of PCT filings, though modest, indicates some intent to preserve the option of later national phase entry abroad. For a company whose installed base spans Chinese cities like Wuhan, Hefei and Tianjin alongside a Taiwan presence, this domestic-first filing strategy appears deliberate. Expansion into markets like the United States and Japan remains limited relative to the company’s stated subsidiary presence there, which may be worth monitoring as international operations scale.
Where is the Piotech Patent Portfolio Building Protection Across Key Technologies?
IPC analysis of the Piotech Patent Portfolio reveals two dominant technology clusters. Coating of Metallic Material, under IPC class C23C, leads with 858 families, representing 39.5% of all filings. Close behind is H10P, Bulk Acoustic Wave Devices, with 671 families and a 30.9% share. Together these two classes account for more than 70% of the entire portfolio’s technical focus.
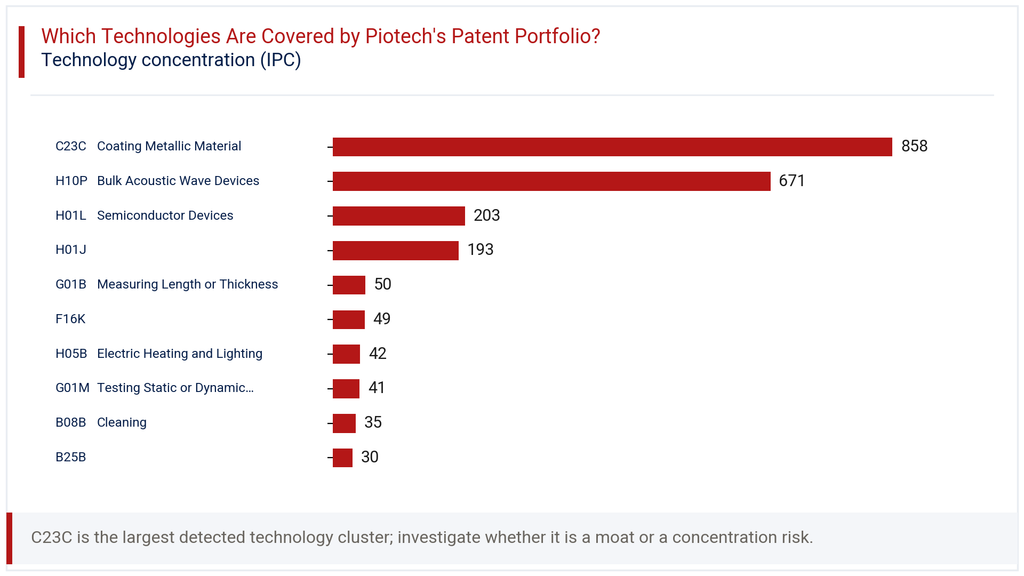
The technology chart in this section also shows meaningful activity in H01L, Semiconductor Devices, at 203 families and 9.3%, alongside H01J at 193 families and 8.9%. Smaller clusters include measuring and testing technologies such as G01B and G01M, along with cleaning equipment under B08B. This concentration pattern reflects Piotech’s core business in thin-film deposition equipment, PECVD, ALD and SACVD systems rely heavily on coating processes. The strong presence of bulk acoustic wave technology suggests expanding interest in RF filter and sensor-related applications. For a prospective partner or competitor, this technology distribution signals where Piotech’s engineering investment is most heavily directed.
How Has the Piotech Patent Portfolio Evolved Across Filing Geographies?
Viewing filing activity by year and jurisdiction together adds useful texture to the broader trend. The heatmap in this section shows China’s filings tracking the overall portfolio curve almost exactly, rising from 23 in 2014 to 396 in 2025. This close correlation confirms that domestic filings are the primary driver of the portfolio’s overall growth pattern.
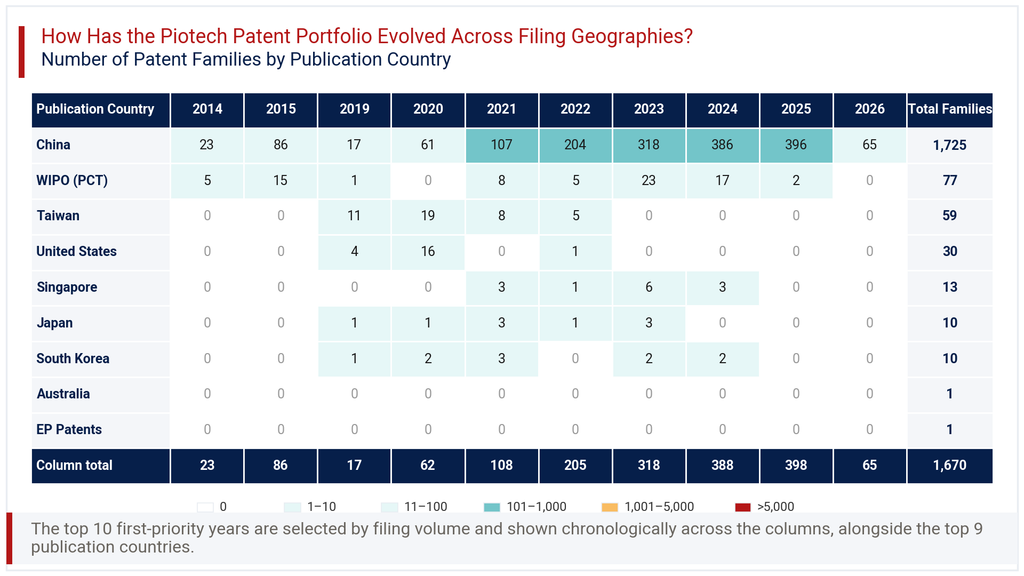
International filing activity tells a different story. Taiwan filings appeared mainly between 2019 and 2022, peaking at 19 in 2020 before disappearing from more recent years. United States filings followed a similar short window, with 16 families in 2020 and almost nothing since. WIPO PCT filings have been more persistent, appearing in most years since 2014, with a notable 23 in 2023. Smaller jurisdictions like Singapore, Japan and South Korea show scattered single-digit activity across different years, without a consistent pattern. This suggests that international filing decisions at Piotech have been more opportunistic or project-specific, rather than part of a steady annual filing programme the way domestic filing has become.
Consultant’s Perspective on Piotech Patent Portfolio
The Piotech Patent Portfolio reflects a company whose intellectual property strategy closely mirrors its commercial growth curve. The sharp rise in filings since 2020, reaching 398 in 2025 alone, lines up with Piotech’s public listing and expanding installed base. This is a portfolio built around core deposition technology, with C23C and H10P classes dominating technical coverage.
What stands out most is the geographic imbalance. With 99.5% of filings concentrated in China, Piotech has yet to build meaningful patent coverage in markets where it already has stated commercial presence, including the United States. For a company competing in a global equipment supply chain, this gap could matter as export markets grow more significant. Competitors or customers evaluating Piotech’s technology position internationally will find limited patent protection outside China to assess freedom-to-operate risk against.
My recommendation is straightforward: Piotech should consider a more deliberate international filing programme, particularly through PCT pathways already in modest use. Given the pending share of 42.9%, much of the portfolio’s eventual legal strength is still being determined. Monitoring how these pending applications convert to grants over the next two to three years will be a useful indicator of portfolio maturity.
Explore Deeper Insights with Expertlancing Research
Understanding a patent portfolio takes more than reading charts, it requires context on technology, competitors and market timing. Expertlancing Research helps clients translate portfolio data like this into actionable business and investment decisions. Whether you are assessing a potential partner, tracking a competitor, or evaluating freedom-to-operate risk, our analysts can build a tailored patent intelligence study around your specific question. Reach out to Expertlancing Research to commission a deeper, customized review of any company’s patent position.