


The Quanta Patent Portfolio spans 6,375 patent families, offering a window into how this Taiwanese hardware manufacturer protects its engineering output. Of these families, 42.0% remain active today, a figure covering both granted and pending cases. The portfolio counts 2,375 granted patents alongside 302 pending applications, producing a grant rate of 37.3%. A combined 3,698 families sit in lapsed, expired, or revoked status. These figures describe prosecution and maintenance outcomes only, not a verdict on patent quality or enforceability.
Filing activity peaked outside the recent window, with the pre-2008 bucket alone recording 2,580 families, while 2021 stands out among tracked years with 329 filings. Taiwan leads as the top jurisdiction, holding a 54.9% share, and the portfolio spans 10 jurisdictions in total. On the technology side, G06F Digital Data Processing dominates as the leading cluster, accounting for 2,114 families, far ahead of any other classification.
This report is meant to help readers interpret Quanta’s filing behaviour, not to pronounce judgment on commercial outcomes. Filing volume alone does not confirm market success, product adoption, or a durable competitive edge. Readers considering business or investment decisions should verify specific patent families independently before relying on them. The analysis that follows offers directional insight, drawn strictly from portfolio-level patterns rather than case-by-case legal review.
About Quanta
Company Profile: Quanta Computer Incorporated is a Taiwanese contract manufacturer of electronic hardware. The company is a Taiwanese contract manufacturer of electronic hardware. Established in May 1988, Quanta Computer is one of the Fortune Global 500 Companies and one of the world’s leading notebook manufacturers. Quanta’s business extends to enterprise network systems, home entertainment, mobile communication, automotive electronics, and digital home markets.
The company also designs, manufactures and markets GPS systems, including handheld GPS, in-car GPS, Bluetooth GPS and GPS with other positioning technologies. It has extended its reach to cloud computing, enterprise network solutions, mobile communications products, smart home products, autotronics, smart healthcare, IoT, and AI applications. Its headquarters is in Taoyuan City, Taiwan.
The company reported revenue of US$34.860 billion and net income of US$1.274 billion in 2023, with 56,708 employees. Its subsidiary, Quanta Cloud Technology, supplies servers and data center hardware to hyperscale operators globally.
How Healthy is Quanta Patent Portfolio?
Patent portfolio health for Quanta presents a mixed picture once legal status is broken down. Granted patents make up 37.3% of the total, while pending applications add another 4.7%, together producing the 42.0% active rate cited earlier. On the other side, lapsed families account for 39.4%, expired ones 15.8%, and revoked cases 2.8%. The composition chart in this section shows lapsed status as the single largest bucket, slightly ahead of granted patents themselves.
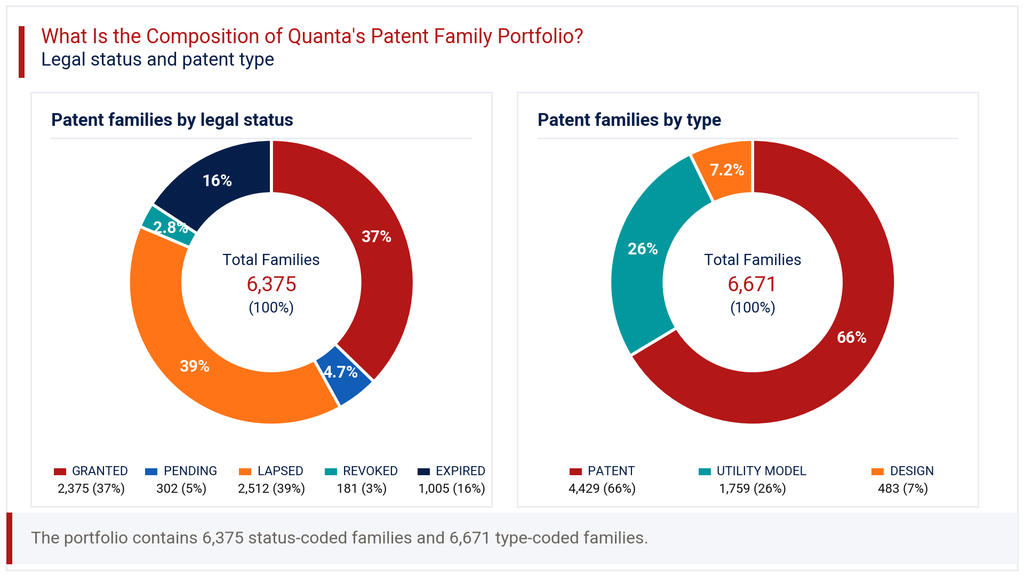
That balance suggests a portfolio where a meaningful share of older filings has run its natural course rather than being actively defended. Patent type adds further texture: standard patents represent 66.4% of filings, utility models 26.4%, and design rights 7.2%. The heavy utility model share, more common in Taiwan and China, points to a strategy of protecting incremental engineering improvements, not only breakthrough inventions. For a contract manufacturer operating across fast-moving hardware categories, this mix looks consistent with how the business actually operates, favouring broad coverage over concentrated, high value filings.
How Has the Quanta Patent Portfolio Evolved Over Time?
Patent filing trends across the Quanta Patent Portfolio show a long history, with 2,580 families filed in or before 2007. Annual filings in the tracked years since then have ranged roughly between 164 and 329, without a single sustained growth trajectory. The filing-trend chart in this section shows 2021 as the strongest recent year, with 329 families, following closely behind a strong 2020 at 327.
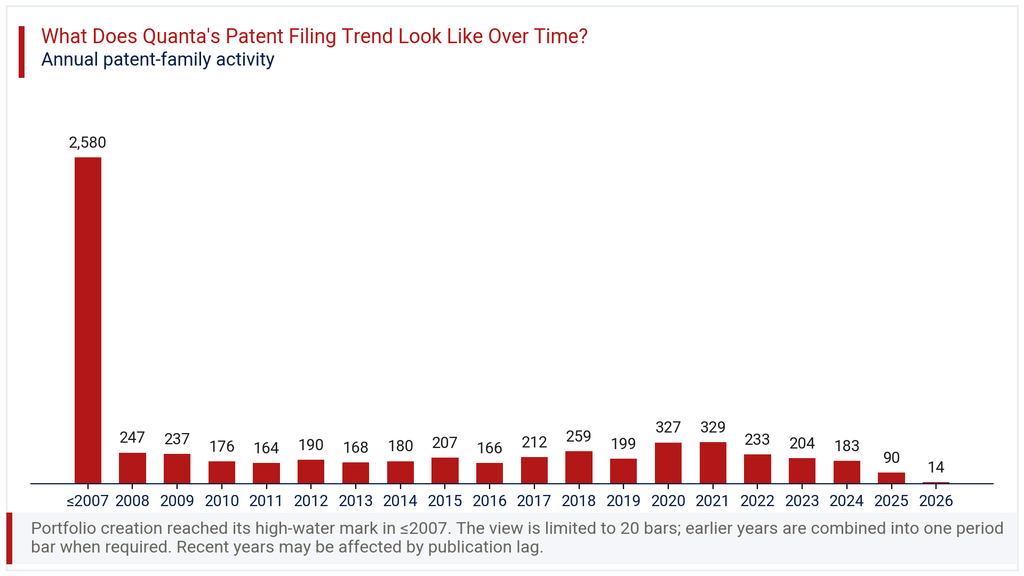
Filings taper in 2022, 2023, and 2024, settling at 233, 204, and 183 respectively, before dropping sharply to 90 in 2025 and just 14 in 2026. The data shows a 84.4% decline in the latest tracked year. That steep fall is better read as a publication lag artifact than a genuine pullback in R&D activity. Patent applications typically take many months, sometimes years, to appear in public databases after filing. Readers should treat the last one to two years as incomplete rather than conclusive evidence of slowing innovation at Quanta.
Where Does the Quanta Patent Portfolio Prioritize Patent Protection?
Patent geography within the Quanta Patent Portfolio centres heavily on three markets. Taiwan leads with a 54.9% share, reflecting the company’s home base and manufacturing roots. The United States follows closely at 50.1%, and China sits near identical levels at 49.0%. These three jurisdictions clearly anchor the filing strategy, together dwarfing every other geography tracked.
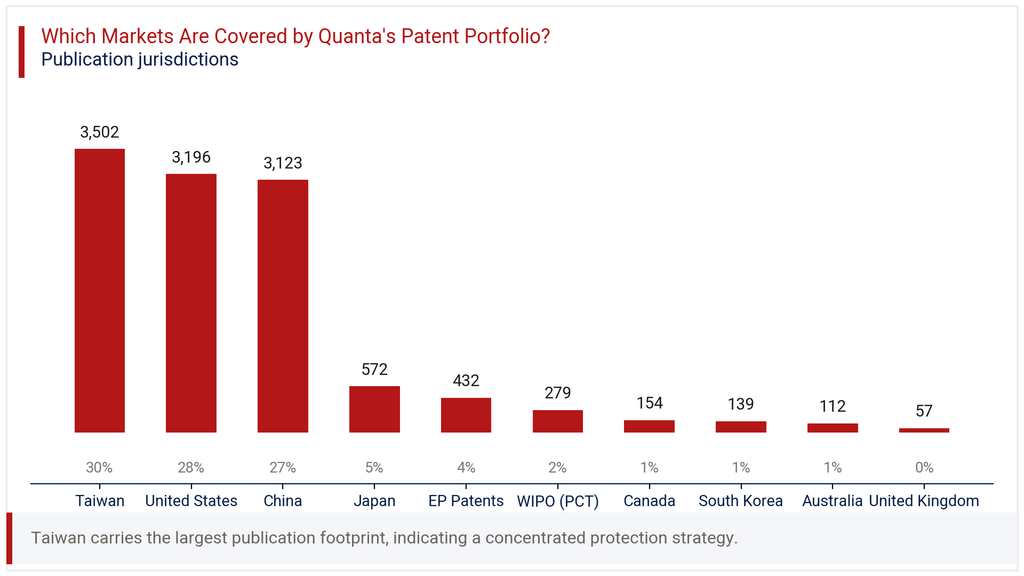
Beyond this core group, coverage drops off considerably. Japan holds 9.0%, the European Patent route accounts for 6.8%, and WIPO PCT filings sit at 4.4%. Canada, South Korea, Australia, and the United Kingdom each register below 2.5%. The geographic chart in this section makes the concentration plain: Quanta protects its core inventions where it manufactures, sells, and competes most directly, then extends selectively into secondary markets. This pattern fits a contract manufacturer whose customer relationships and supply chains run primarily through Greater China and North America, with Japan as a notable secondary market.
Where is the Quanta Patent Portfolio Building Protection Across Key Technologies?
IPC analysis of the Quanta Patent Portfolio points clearly toward computing and hardware fundamentals. G06F Digital Data Processing leads with 2,114 families, representing 35.7% of classified filings. H05K Printed Circuits and Casings follows at 19.2%, consistent with Quanta’s hardware assembly and device manufacturing focus. G11B Information Storage on Record Carriers adds another 9.7%.
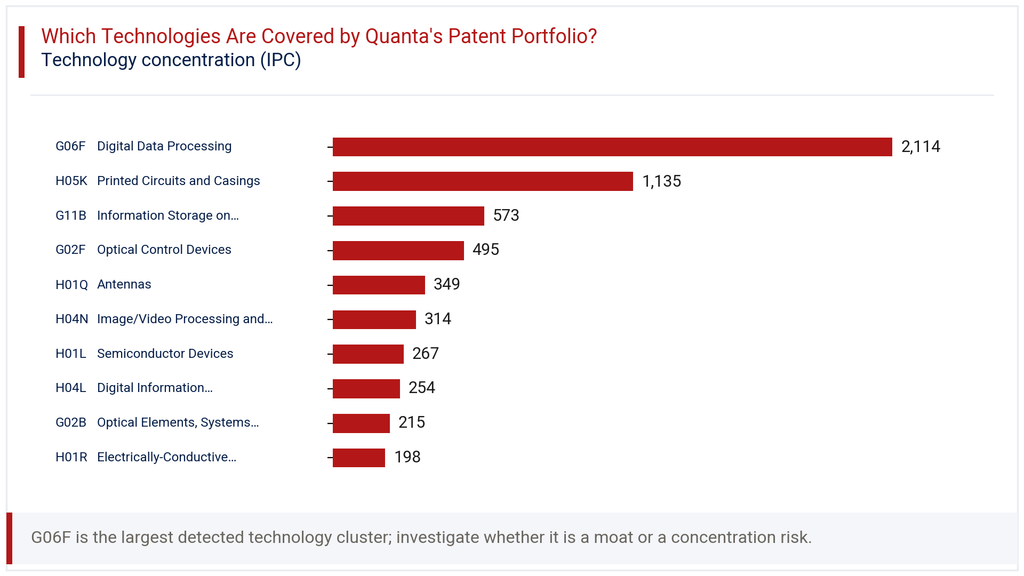
Further down the ranking, G02F Optical Control Devices holds 8.4%, H01Q Antennas sits at 5.9%, and H04N Image/Video Processing and Display accounts for 5.3%. Semiconductor devices under H01L contribute 4.5%, while digital transmission technology under H04L adds 4.3%. The technology chart in this section shows a clear hierarchy, with computing and circuit packaging well ahead of optics, imaging, and connectivity categories. This spread mirrors Quanta’s actual product mix: notebooks, servers, and networking hardware, where data processing and physical circuit design remain the core engineering challenges worth protecting.
How Has the Quanta Patent Portfolio Evolved Across Filing Geographies?
The heatmap in this section tracks filing behaviour across jurisdictions and years, revealing some notable shifts. Taiwan, the United States, and China each filed in the 150 to 245 range through 2004 to 2006, before settling into a steadier 100 to 190 band from 2014 onward. China’s early peak of 245 families in 2006 stands out as the single highest jurisdiction-year figure in this window.
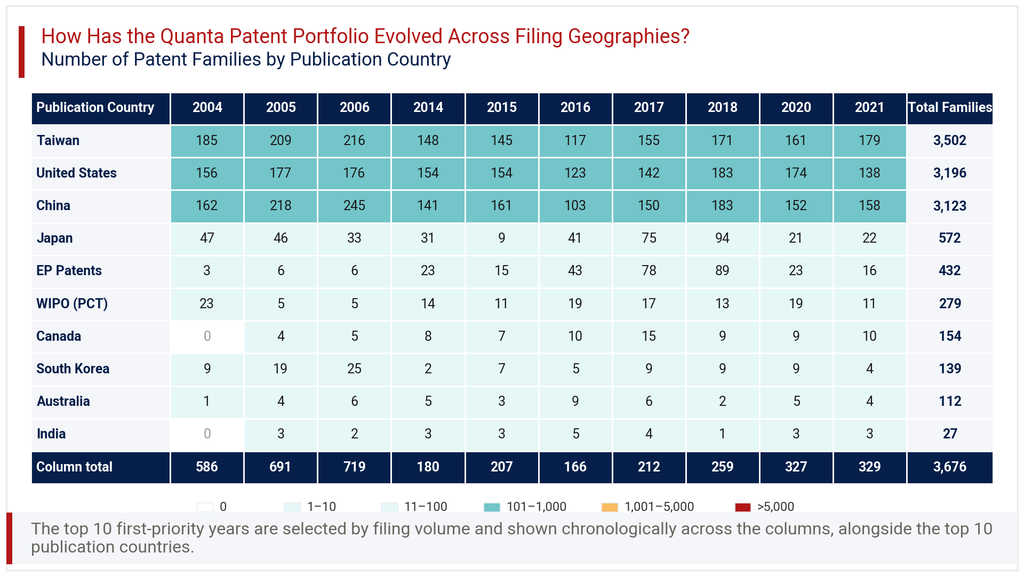
Japan shows a different pattern, dipping to just 9 filings in 2015 before climbing back to 94 in 2018, its strongest year tracked. The European Patent route tells a similar story, rising from single digits in 2004 to 89 filings by 2018, suggesting a deliberate push into European protection during that period. Smaller jurisdictions like Canada, South Korea, and Australia stayed in single or low double digits throughout, with occasional modest increases. The overall pattern suggests Quanta recalibrated its international filing emphasis around 2016 to 2018, before the broader slowdown visible in later years across all geographies.
Consultant’s Perspective on Quanta Patent Portfolio
Viewed as a whole, the Quanta Patent Portfolio reflects a manufacturer protecting its core competency rather than chasing patent volume for its own sake. The concentration in computing and circuit technology, paired with heavy utility model use, fits a company whose value lies in execution and engineering refinement. The 39.4% lapsed share deserves attention, though it likely reflects normal portfolio churn at this scale rather than neglect.
The geographic footprint, anchored in Taiwan, the United States, and China, matches where Quanta actually manufactures and sells. That alignment is a genuine strength, not a coincidence. What stands out less favourably is the comparatively thin presence in emerging manufacturing and consumption markets like India, where filings remain in single digits most years. As supply chains diversify beyond traditional hubs, a broader filing footprint could better protect Quanta’s position with newer partners and customers.
My recommendation: use this portfolio analysis as a starting point, not an endpoint. Specific families tied to cloud infrastructure or AI-adjacent hardware deserve closer legal and technical review, given Quanta Cloud Technology’s growing role in the business.
Explore Deeper Insights with Expertlancing Research
This overview of the Quanta Patent Portfolio only scratches the surface of what a detailed patent study can reveal. Expertlancing Research helps technology leaders, investors, and legal teams go beyond summary statistics into family-level validation, competitor benchmarking, and white space analysis. If you are evaluating Quanta’s technology position, or need a comparable study on a competitor, our analysts can build a tailored report around your specific business question. Reach out to start a conversation about what deeper patent intelligence could reveal for your next decision.