


The Silan patent portfolio spans 2,251 total patent families, offering a window into how this Chinese semiconductor maker builds and defends its technology base. Of this portfolio, 59.8% remains active, a figure that covers both granted and pending families. Granted families number 1,181, while 166 sit pending before patent offices. The grant rate stands at 52.5%, a reasonable conversion level for a filer of this scale. Lapsed, expired and revoked families together total 904 (611 lapsed, 216 expired, and 77 revoked). These are prosecution and maintenance figures only, not a judgment on patent quality or enforceability.
Filing activity peaked in 2012, when Silan filed 206 patent families, a sharp jump from prior years. China dominates the jurisdiction mix, accounting for 98.0% of filings, across a total of 10 jurisdictions covered by the portfolio. The leading technology cluster is H01L (Semiconductor Devices), with 765 families, nearly half the entire portfolio. This concentration signals where Silan has placed its deepest research and filing commitment.
This article works through the Silan patent portfolio using legal status, filing trends, jurisdiction spread and technology clustering as the main lenses. Filing counts alone do not prove product success or market leadership. Readers assessing Silan for partnership, investment or competitive benchmarking should treat these patterns as a starting point. Specific patent families deserve direct verification before being used in due diligence, licensing talks or litigation strategy.
About Silan
Company Profile: Hangzhou Silan Microelectronics, known as Silan, is a publicly listed Chinese semiconductor company headquartered in Hangzhou. The company focuses on the design of integrated circuit chip and the manufacturing of semiconductor microelectronics-related products. It is one of the largest integrated device manufacturers in China. Silan was founded on 25 September 1997 by Chen Xiangdong and six partners , and was one of the first private IC manufacturing companies in China.
It held its initial public offering on 11 March 2003, becoming the first IC design company to be publicly listed in China. Silan originally started with a 5-inch wafer chip production line producing 5,000 pieces a month, then built a 6-inch production line after listing. The company reports revenue of CN¥9.34 billion for 2023, with total assets of CN¥23.91 billion and 9,294 employees that year.
How Healthy is Silan Patent Portfolio?
Patent portfolio health depends on how many families remain enforceable versus how many have fallen away. Silan’s legal status split shows 52.5% granted, 7.4% pending, 27.1% lapsed, 9.6% expired and 3.4% revoked. The active rate of 59.8% combines granted and pending families into a single enforceable-or-prospective pool. The composition chart in this section makes the scale of lapsed filings clear, at 611 families. That volume is not unusual for a portfolio built over more than two decades, where older filings naturally age out.
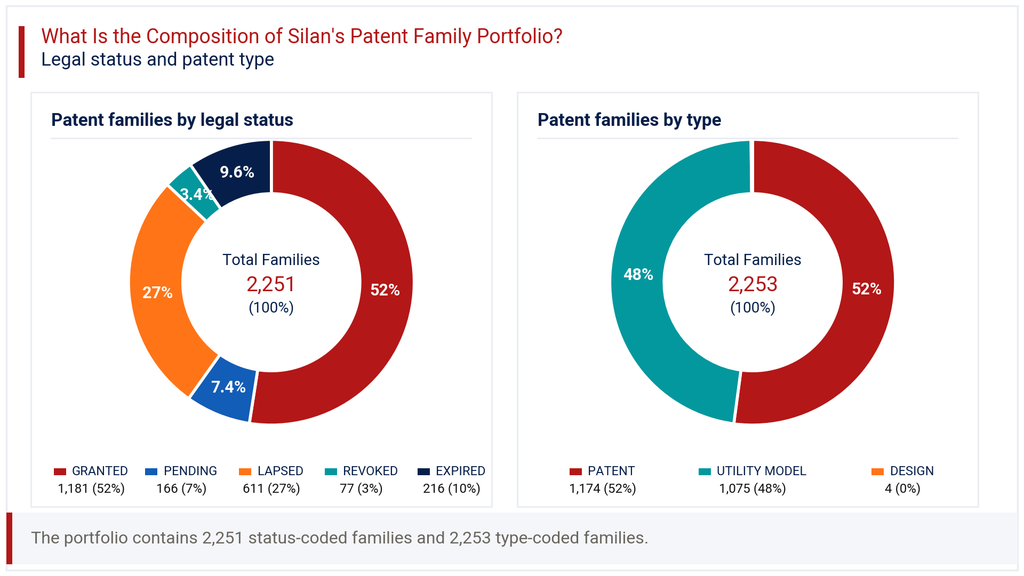
On patent type, the split between Patent (52.1%) and Utility Model (47.7%) is close to even, with Design filings a marginal 0.2%. This near-balance between invention patents and utility models points to a filing strategy that protects both substantial innovation and incremental engineering improvements. Utility models typically carry shorter examination cycles in China, which may explain part of the grant rate of 52.5%. For a reader assessing patent portfolio health here, the message is a portfolio with a solid active core, but meaningful legacy attrition that warrants family-level checks before relying on specific assets.
How Has the Silan Patent Portfolio Evolved Over Time?
Patent filing trends for Silan show a distinct rise-and-plateau shape. Filings grew steadily from 24 in 2010 to a peak of 206 in 2012, then settled into a range mostly between 100 and 180 through the following decade. Years like 2015 (182), 2020 (171) and 2022 (174) show that Silan sustained meaningful filing volume well after its initial surge. The filing-trend chart in this section shows this pattern clearly, with no single year after 2012 coming close to matching that peak.
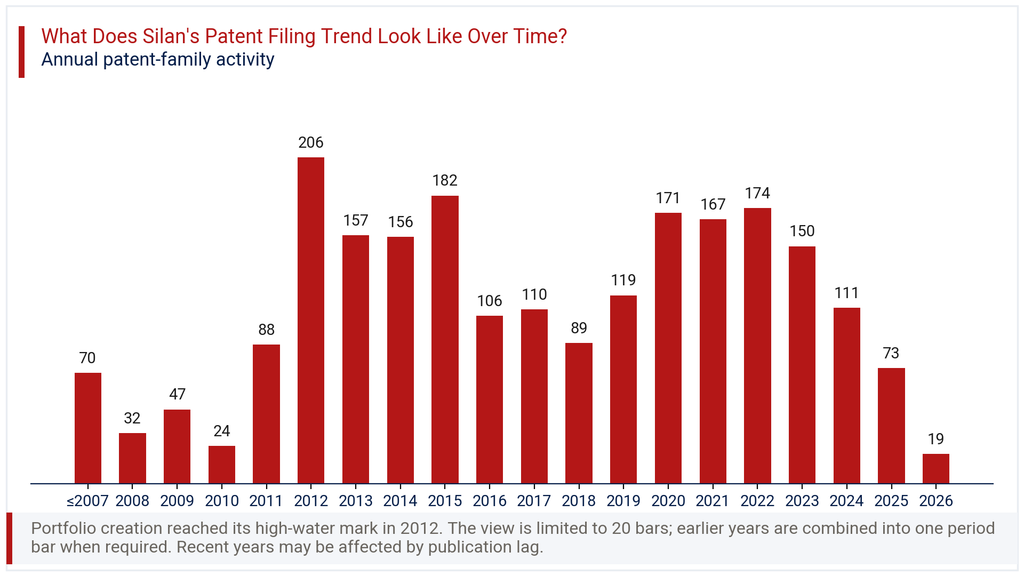
Recent years show a decline, with 2024 at 111 and 2025 at 73, alongside a -74.0% change flagged for the latest year. This drop should be read with caution. Patent applications often take 18 months or longer to publish, so the most recent one to two years typically understate true filing activity. Rather than signaling a real pullback in R&D or filing appetite, this pattern most likely reflects publication lag working through the system. The broader decade-long trend still points to a company filing consistently, not retreating from patent protection.
Where Does the Silan Patent Portfolio Prioritize Patent Protection?
Patent geography for Silan is heavily domestic. China accounts for 98.0% of all filings, covering 2,206 families out of 2,251. The geographic chart in this section shows every other jurisdiction trailing far behind, with WIPO (PCT) filings at 2.5% and the United States at 2.1%. Smaller counts appear in Russia, Taiwan, the EP Patents route, Japan, Canada and South Korea, each under 1.1% of the total.
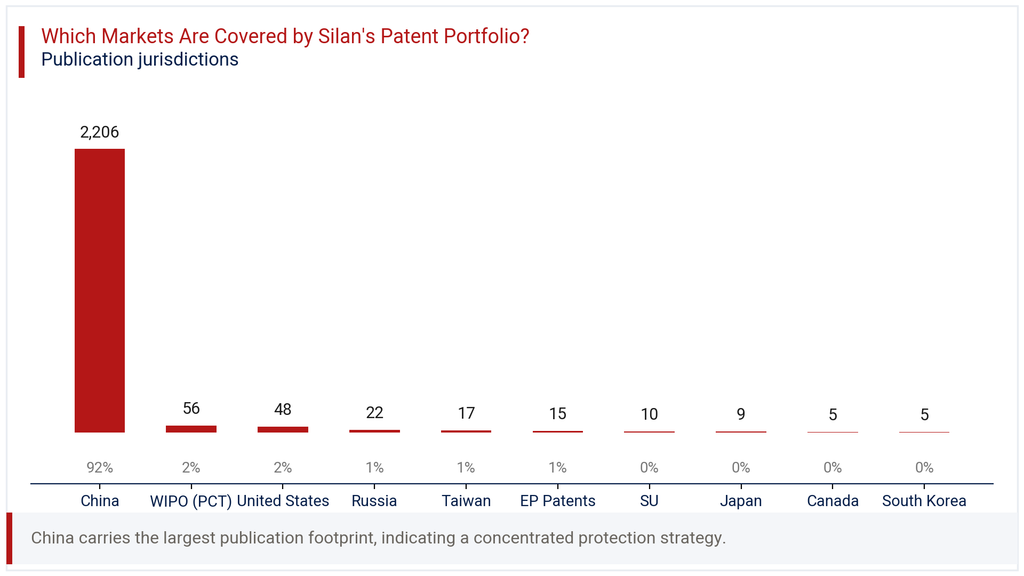
This concentration pattern is typical for a Chinese semiconductor manufacturer whose primary customer base and manufacturing footprint sit within China. The modest international filing, just 48 US families and 56 PCT applications, suggests Silan treats overseas protection as a selective, not a primary, strategy. Companies evaluating Silan as a competitor or licensing partner outside China should note this gap. Limited international filing could mean either lower perceived competitive exposure abroad, or a filing strategy still catching up with Silan’s export ambitions. Either reading calls for closer scrutiny of specific target markets.
Where is the Silan Patent Portfolio Building Protection Across Key Technologies?
IPC analysis of the Silan patent portfolio points to one dominant cluster. H01L (Semiconductor Devices) leads with 765 families, representing 43.9% of the total, by far the largest single category. The technology chart in this section shows a steep drop after that, with H02M (Conversion of Electric Power) next at 241 families (13.8%), followed by H05B (Electric Heating and Lighting) at 156 families (9.0%).
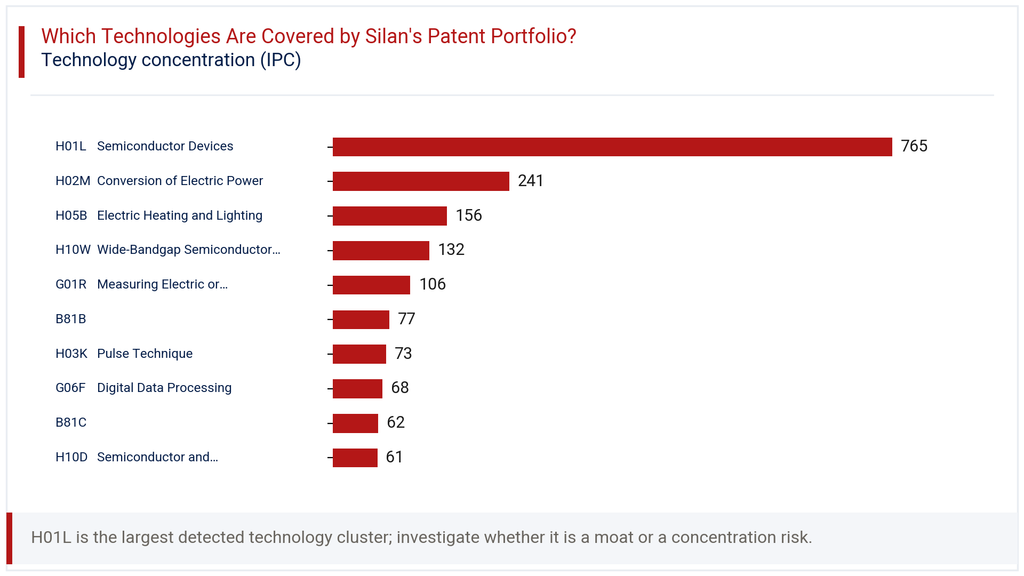
Further down, H10W (Wide-Bandgap Semiconductor Devices) holds 132 families (7.6%), and G01R (Measuring Electric or Magnetic Variables) adds 106 families (6.1%). Smaller clusters include B81B (4.4%), H03K Pulse Technique (4.2%), G06F Digital Data Processing (3.9%), B81C (3.6%) and H10D Semiconductor and Solid-State Devices (3.5%). This spread confirms Silan’s core identity as a semiconductor device manufacturer, with power conversion and wide-bandgap technology as clear secondary strengths. The presence of MEMS-adjacent codes like B81B and B81C suggests some diversification into sensor and micro-device territory, worth watching for future growth.
How Has the Silan Patent Portfolio Evolved Across Filing Geographies?
Looking at filings by year and jurisdiction together reveals how concentrated Silan’s growth has been. In 2012, China alone contributed 205 of the 206 total families filed that year. The heatmap in this section shows this single-country dominance holding steady across every year in the matrix, from 2012 through 2023. Even in years with international activity, such as 2021 when the US recorded 7 families and WIPO (PCT) recorded 9, China’s count of 164 still overwhelms the comparison.
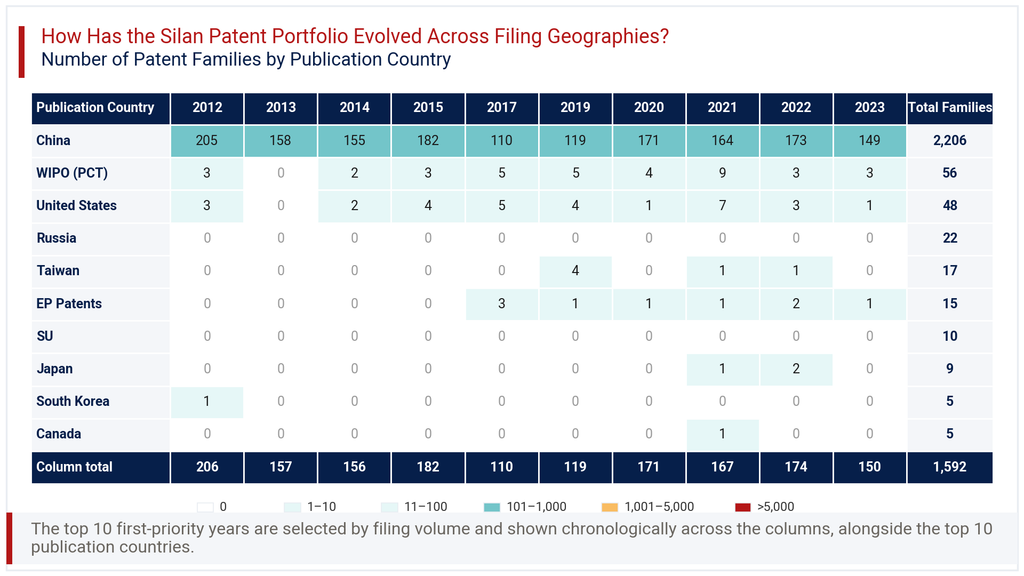
Other jurisdictions appear only sporadically. Taiwan shows filings in 2019 (4), 2021 (1) and 2022 (1), while the EP Patents route appears in small single-digit counts from 2017 onward. Japan and Canada each show isolated single-year entries. This pattern suggests Silan’s international filing is opportunistic rather than built on a consistent multi-year strategy, concentrated around specific technologies or partnerships rather than broad geographic expansion. Any reader tracking Silan’s global IP posture should expect China-first behavior to continue defining the shape of this portfolio.
Consultant’s Perspective on Silan Patent Portfolio
Looked at as a whole, the Silan patent portfolio reflects a domestically anchored semiconductor filer with real depth in core device technology. The 765 families in H01L alone would be a credible standalone portfolio for many mid-sized semiconductor firms. Silan’s 59.8% active rate and 52.5% grant rate suggest a functioning, well-managed filing operation rather than a defensive paper exercise.
The limitation is geographic concentration. With 98.0% of filings in China, Silan’s international enforceability remains thin outside its home market. For competitors or partners operating primarily in China, this portfolio carries real weight. For those assessing cross-border licensing or litigation risk in the US, Europe or Japan, the exposure looks considerably smaller, under 50 families in the US case.
My recommendation for any party evaluating this portfolio is twofold. First, validate the enforceability status of specific families relevant to your market, given the sizeable lapsed and expired pool. Second, watch whether Silan’s modest but present PCT and EP filings grow, as that would signal a shift toward broader international protection. The current data does not yet show that shift happening at scale.
Explore Deeper Insights with Expertlancing Research
This overview only scratches the surface of what a detailed patent study can reveal. Expertlancing Research helps technology companies, investors and legal teams dig deeper into portfolios like Silan’s, validating individual families, mapping competitive overlap and tracking filing behavior across markets. If you are evaluating Silan for partnership, investment or competitive strategy, our analysts can build a tailored assessment around your specific questions. Reach out to Expertlancing Research to turn this snapshot into a decision-ready analysis.