


The Skyworth Patent Portfolio offers a useful window into how a major Chinese electronics group protects its technology investments. Across its filing history, the company holds 6393 total patent families, of which 45.1% remain active through granted or pending status. Of these, 2231 families have been granted and 655 remain pending, giving a grant rate of 34.9%. Meanwhile, 3507 families sit in lapsed, revoked, or expired status combined. These figures describe prosecution and maintenance outcomes only, not a verdict on patent quality or enforceability.
Looking at filing patterns over time, Skyworth’s peak year was 2018, when the company filed 525 families, the highest annual count in its history. China dominates as the top jurisdiction, accounting for 98.3% of filings, and the portfolio spans 10 jurisdictions in total. On the technology side, the leading cluster is H04N (Image/Video Processing and Display), covering 1763 families, confirming the company’s core focus on video and display engineering.
This report is meant to help readers understand the shape and direction of Skyworth’s patent activity, not to draw conclusions about commercial success or market dominance. Filing volume alone does not prove a technology works or sells well. Readers evaluating specific inventions, licensing opportunities, or competitive threats should verify individual patent families directly before relying on them for business or legal decisions. The analysis below unpacks legal status, filing trends, geography, and technology concentration in turn.
About Skyworth
Company Profile: Skyworth Group Co., Ltd., officially a Chinese holding company, was founded in 1988 by Huang Hongsheng and Stephen Wong. Skyworth is a Chinese holding company headquartered in Nanshan High-tech Park, Shenzhen. Its subsidiaries design, manufacture and sell televisions and other audio-visual products, and they also invest in properties. Skyworth has operations in Hong Kong and Inner Mongolia, as well as various locations in Guangdong including Shenzhen, Guangzhou, and Dongguan.
Its subsidiary, SKYWORTH Digital, focuses on set top boxes and network gateways. Founded in 1997, it develops and manufactures set top boxes and network gateways for video service providers and telecom carriers, and is making ongoing investments in 5G, VR, and smart home technologies. Skyworth also entered electric vehicles through Skyworth Auto. Skyworth Auto is a Chinese manufacturer of electric passenger vehicles based in Nanjing, operating since 2017, and the brand belongs to Skywell in partnership with Skyworth Group.
The company is listed on the Hong Kong and Shenzhen stock exchanges.
How Healthy is Skyworth Patent Portfolio?
Patent portfolio health depends heavily on legal status composition, and Skyworth’s numbers tell a mixed story. Granted patents make up 34.9% of the total, while pending applications add another 10.2%, bringing the active rate to 45.1%. On the other side, lapsed families account for 32.3%, revoked families for 19.0%, and expired families for 3.6%. The composition chart in this section shows that more than half the portfolio sits outside active protection today.
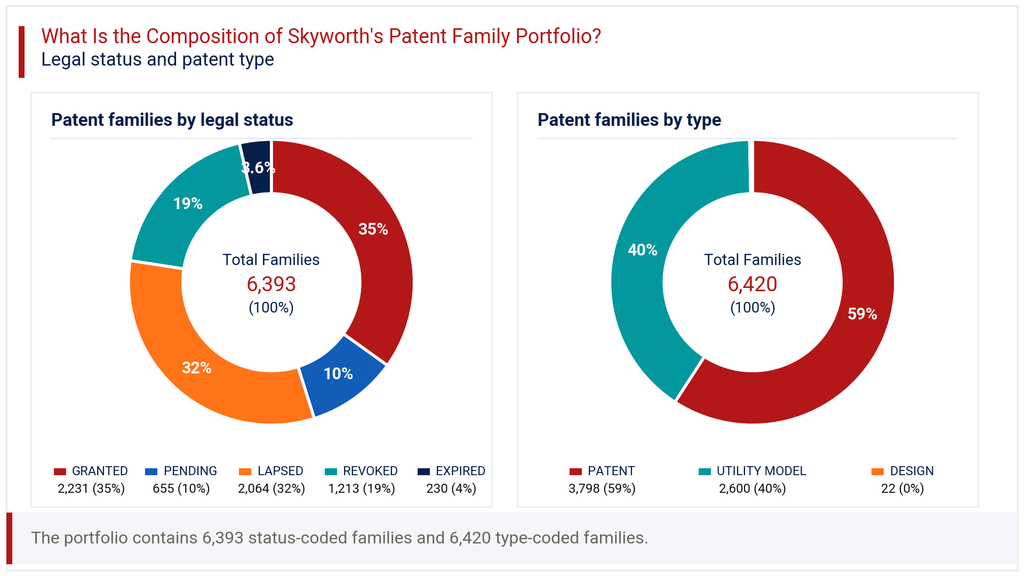
This pattern is common for companies with high filing volumes over long periods, since older families naturally age out through non-payment of renewal fees or expiry. The patent-type split adds further texture: traditional patents represent 59.2% of filings, utility models 40.5%, and design rights just 0.3%. This heavy reliance on utility models, alongside full patents, reflects a filing strategy suited to incremental product improvements common in consumer electronics. The relatively low revoked share compared to lapsed suggests most attrition stems from deliberate non-renewal rather than successful third-party challenges. For a reader assessing patent portfolio health, the takeaway is a sizeable but aging asset base, with active protection concentrated in more recent filing years.
How Has the Skyworth Patent Portfolio Evolved Over Time?
Patent filing trends across Skyworth’s history show a company reacting to market cycles rather than filing at a flat, predictable pace. Early filings exceeded 513 families in years up to 2007, dipped sharply through the early 2010s to lows like 85 in 2010, then rebounded steadily. Filing activity climbed through the mid-2010s, reaching 409 in 2017 before peaking at 525 in 2018. The filing-trend chart in this section captures this cyclical rise and fall clearly.
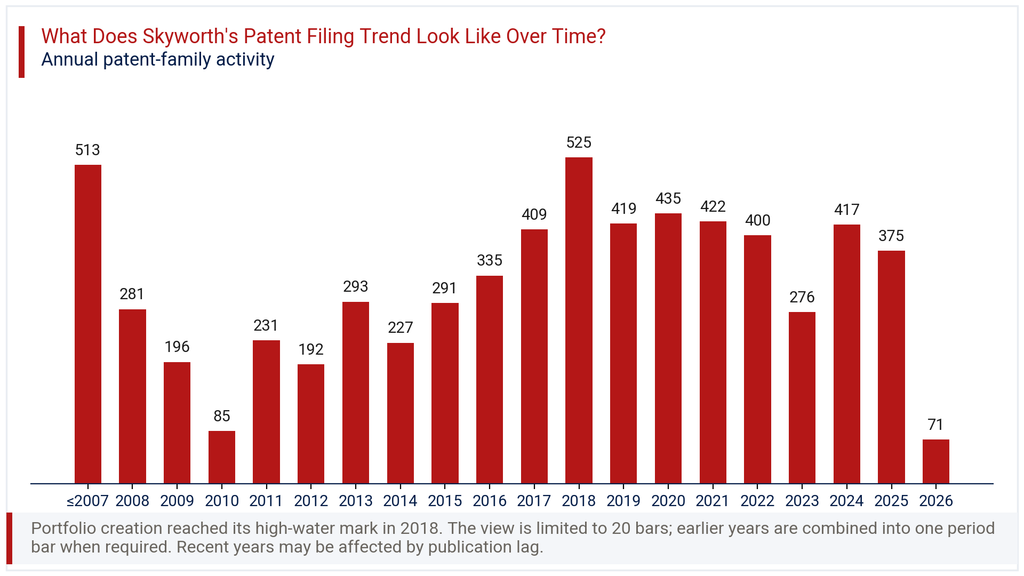
After 2018, volumes moderated but stayed strong, with 435 families in 2020 and 422 in 2021. A gentle decline followed into 2023 at 276, before activity picked back up to 417 in 2024. The most recent two years, 2025 and 2026, show lower counts of 375 and 71 respectively, including a -81.1% change in the latest year. This drop very likely reflects publication lag rather than an actual pullback in filing activity, since recently filed applications often take months to appear in public patent databases. Readers should treat the last one to two years as provisional rather than conclusive.
Where Does the Skyworth Patent Portfolio Prioritize Patent Protection?
Patent geography for Skyworth is overwhelmingly domestic. China accounts for 98.3% of all filings, with 6287 families, confirming that home-market protection remains the clear priority. The geographic chart in this section shows a steep drop-off after China, with WIPO PCT filings at 7.0% share and 448 families representing the main route to international protection.
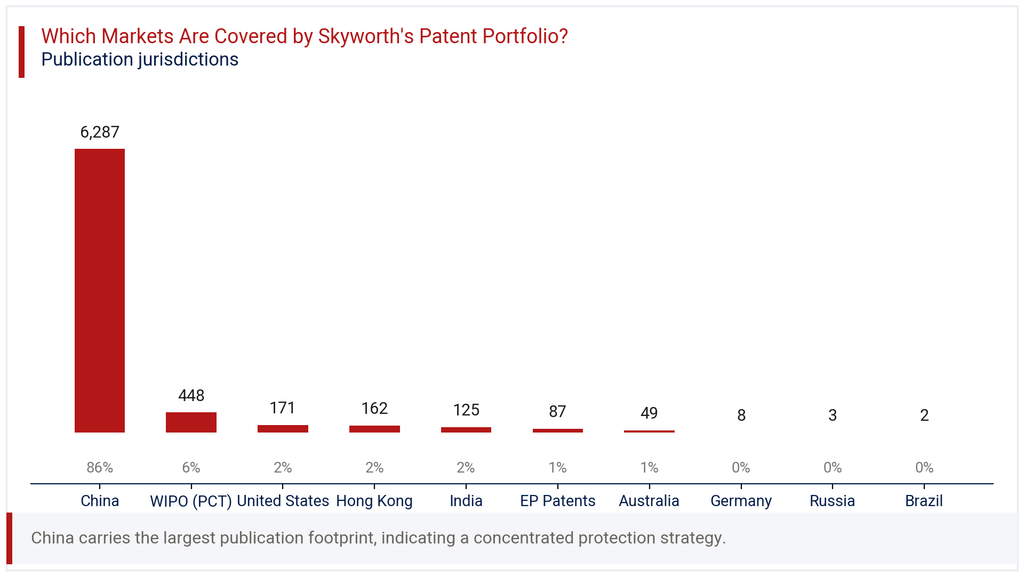
Beyond China and PCT filings, the United States holds 171 families at 2.7% share, Hong Kong 162 families at 2.5%, and India 125 families at 2.0%. European Patent filings reach 87 families, Australia 49, and smaller counts appear in Germany, Russia, and Brazil. This distribution suggests Skyworth treats international filing selectively, likely tied to specific export markets or manufacturing partnerships rather than broad global coverage. For a business reader, this pattern signals that competitors or partners outside China face limited patent exposure from Skyworth in most jurisdictions, barring the US, Hong Kong, and India where moderate activity exists.
Where is the Skyworth Patent Portfolio Building Protection Across Key Technologies?
IPC analysis of the Skyworth Patent Portfolio points clearly toward video and display technology as the dominant theme. The leading class, H04N (Image/Video Processing and Display), covers 1763 families and 37.0% share, far ahead of any other category. The technology chart in this section shows a steep concentration in this single cluster relative to the rest.
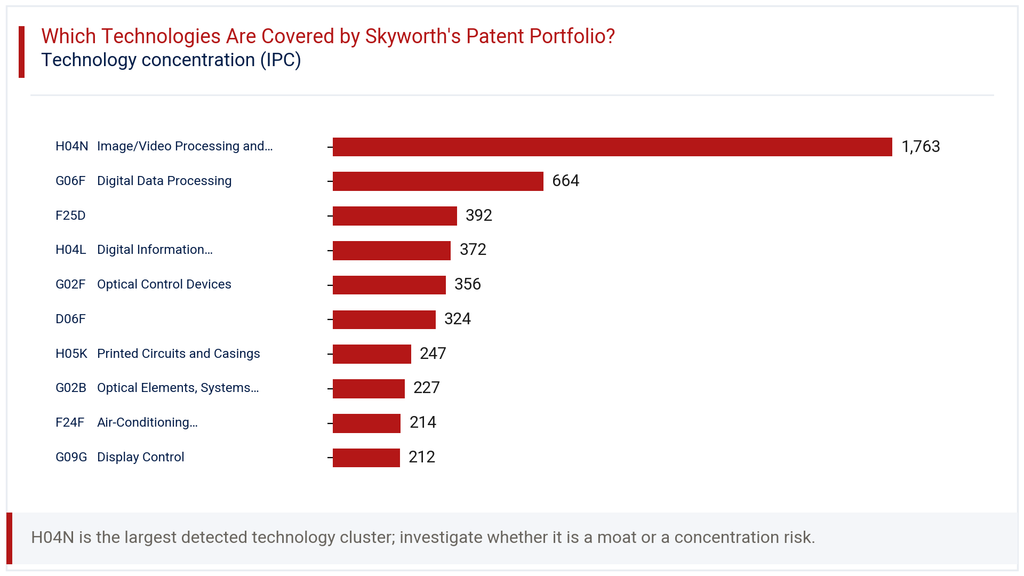
Digital data processing under G06F follows with 664 families at 13.9% share, reflecting software and computing investments that support smart television and set-top box functions. Refrigeration technology under F25D holds 392 families at 8.2%, and digital transmission under H04L accounts for 372 families at 7.8%. Optical control devices, printed circuits, air conditioning, and display control round out the top ten classes, each contributing modest but meaningful shares. This spread indicates Skyworth’s innovation effort extends beyond its core television business into home appliances and communication infrastructure, consistent with its diversified subsidiary structure spanning digital, auto, and appliance divisions.
How Has the Skyworth Patent Portfolio Evolved Across Filing Geographies?
The heatmap in this section tracks filing activity by jurisdiction and year, revealing how Skyworth’s international strategy has shifted. China has remained the constant anchor, rising from 291 families in 2015 to 503 in 2018, then settling around 414 to 435 in subsequent years through 2024. This steady domestic volume contrasts sharply with international filing patterns.
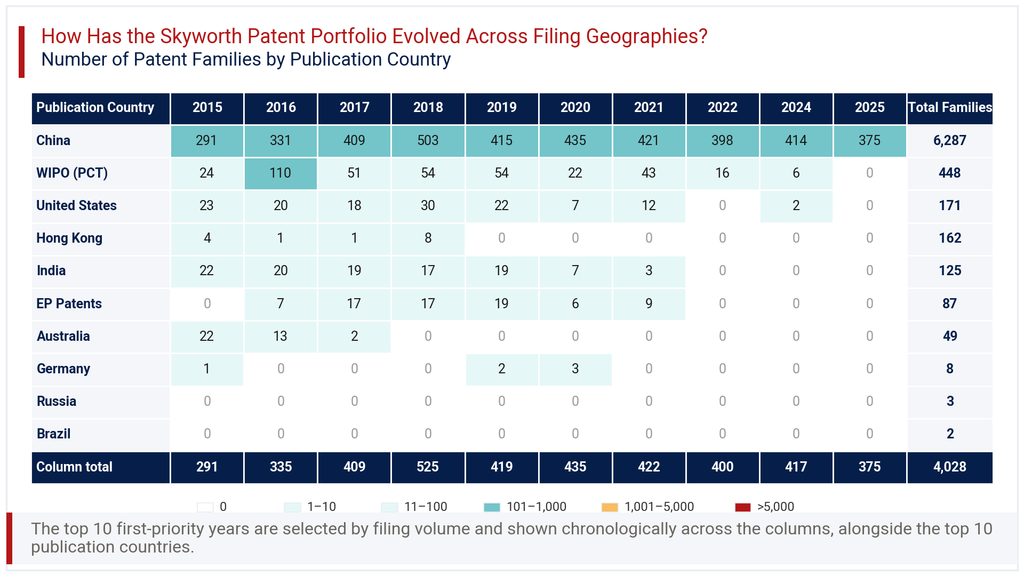
WIPO PCT filings peaked at 110 families in 2016 before declining to single digits by 2024, with none recorded in 2025. The United States shows a similar fade, from 30 families in 2018 down to 2 in 2024 and none in 2025. India, Hong Kong, Australia, and EP filings all show comparable patterns, active through 2018 to 2019, then tapering sharply toward 2021 and beyond. This synchronized decline across nearly every non-China jurisdiction suggests a deliberate pullback in international filing budgets, rather than jurisdiction-specific setbacks, likely reflecting a cost-conscious refocus on the core China market after 2020.
Consultant’s Perspective on Skyworth Patent Portfolio
From a strategic reading of the Skyworth Patent Portfolio, the company presents a classic profile of a large domestic manufacturer with selective global reach. The concentration in H04N display technology at 37.0% share confirms where real engineering investment sits, and it aligns naturally with Skyworth’s television and set-top box businesses. The near-total reliance on China, at 98.3% of filings, is not necessarily a weakness, but it does limit the portfolio’s defensive value outside Chinese borders.
What stands out most is the retreat from international filing after 2018 across almost every jurisdiction tracked. Whether this reflects budget discipline, a shift toward trade secrets, or reduced export ambitions is not something filing data alone can answer. Companies evaluating Skyworth as a partner, licensor, or competitor should treat the Skyworth Patent Portfolio as strong evidence of domestic technical depth, but weaker evidence of international enforcement capacity. Going into new partnerships or markets, due diligence should include checking specific family status in target jurisdictions rather than relying on aggregate counts. A renewed uptick in overseas filing, if it occurs, would be worth monitoring closely as a signal of expanding global ambition.
Explore Deeper Insights with Expertlancing Research
Understanding a patent portfolio takes more than counting filings. Expertlancing Research helps technology buyers, investors, and legal teams translate raw patent data into decisions that matter, from licensing due diligence to competitive benchmarking. If this analysis raised questions about Skyworth’s technology direction, international exposure, or specific patent families worth a closer look, our research team can help. Reach out to Expertlancing Research for a deeper, customized assessment built around your business need.