


The TCL Patent Portfolio offers a useful window into how one of China’s largest electronics makers protects its technology investments. Across a total of 41,956 patent families, 58.9% remain active, a figure that covers both granted and pending cases. Of these, 18,598 patents stand granted and 6,107 applications are still pending examination. The grant rate across the portfolio sits at 44.3%, which tells us how prosecution outcomes have historically played out. The remaining cases, totaling 17,251 when lapsed, expired, and revoked families are combined, reflect a sizeable share that did not survive the full patent lifecycle. These figures describe prosecution and maintenance status only; they are not a verdict on patent quality or enforceability.
Filing activity peaked in 2017, when TCL filed 3,340 patent families, marking the busiest year in the company’s recorded filing history. China dominates the jurisdictional picture, accounting for 98.0% of filings, spread across 10 jurisdictions worldwide in the dataset reviewed. On the technology side, digital data processing under IPC class G06F leads the portfolio with 5,517 families, ahead of every other technical cluster tracked. This concentration pattern says a great deal about where TCL has chosen to defend its engineering work most heavily.
This report is meant to help readers interpret TCL’s filing behaviour at a portfolio level, not to make claims about individual inventions or product lines. Raw filing counts do not, by themselves, prove commercial success or confirm a competitive edge in any given market. Anyone using this analysis for deal evaluation, licensing talks, or competitive benchmarking should verify specific patent families independently. Treat the numbers here as a starting point for deeper diligence, not a substitute for it.
About TCL
Company Profile: TCL Technology is a Chinese, partially state-owned electronics company headquartered in Huizhou, Guangdong province. TCL develops, manufactures, and sells consumer electronics like television sets, mobile phones, air conditioners, washing machines, refrigerators, and small electrical appliances. It was the second-largest television manufacturer by market share in 2022 and 2023. The company reports it focuses on two core industries: display technology and renewable energy photovoltaics. TCL reports a global presence of 29 R&D centers and 18 manufacturing bases. Its official site states products reach 160+ countries, with manufacturing and R&D centers worldwide. Per Wikipedia, revenue reached US$20.895 billion in 2024, with operating income of US$3.691 billion and net income of US$0.687 billion.
TCL has also signed a long-term Olympic sponsorship, with the company announcing an IOC and TCL global TOP Partnership through to 2032. Subsidiary TCL CSOT is a major display panel supplier.
How Healthy is TCL Patent Portfolio?
Patent portfolio health depends heavily on legal status mix, and TCL’s numbers tell a layered story. Granted patents make up 44.3% of the total, the single largest status category. Pending applications add another 14.6%, giving an active rate of 58.9% when the two are combined. On the other side, lapsed families account for 19.9%, revoked cases for 17.5%, and expired patents for a smaller 3.7%. The composition chart in this report shows this split clearly, with nearly four in ten families having exited the active pool entirely.
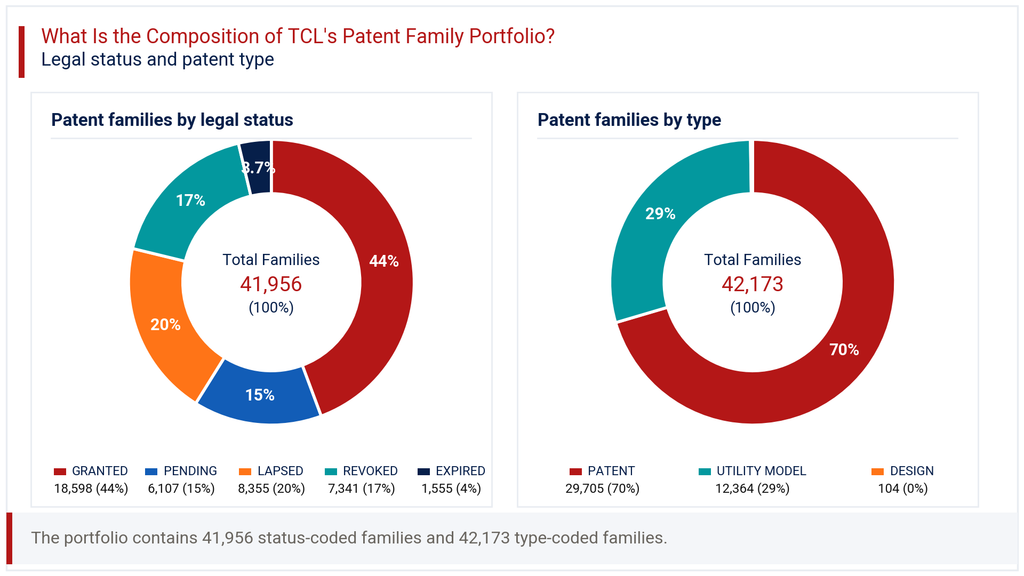
Patent type adds another dimension worth noting. Standard patents represent 70.4% of the portfolio, utility models 29.3%, and design filings a marginal 0.2%. This heavier weighting toward full patents, rather than utility models, suggests TCL pursues longer protection terms for its core inventions. The sizeable lapsed and revoked share, however, points to active portfolio pruning or contested examination outcomes in certain markets. For a company operating at this scale, that level of attrition is not unusual, but it does warrant closer review of which technology areas lose protection most often. A healthy-looking grant rate combined with meaningful attrition is a pattern diligence teams should examine family by family.
How Has the TCL Patent Portfolio Evolved Over Time?
TCL’s patent filing trends show a long climb followed by a recent pullback. Filings grew steadily from 868 in 2010 to 1,796 by 2014, then surged past 2,700 annually from 2015 onward. The peak arrived in 2017 at 3,340 families, with 2020 close behind at 3,818. The filing-trend chart in this section traces that rise and the gradual decline that followed, down to 2,509 in 2024.
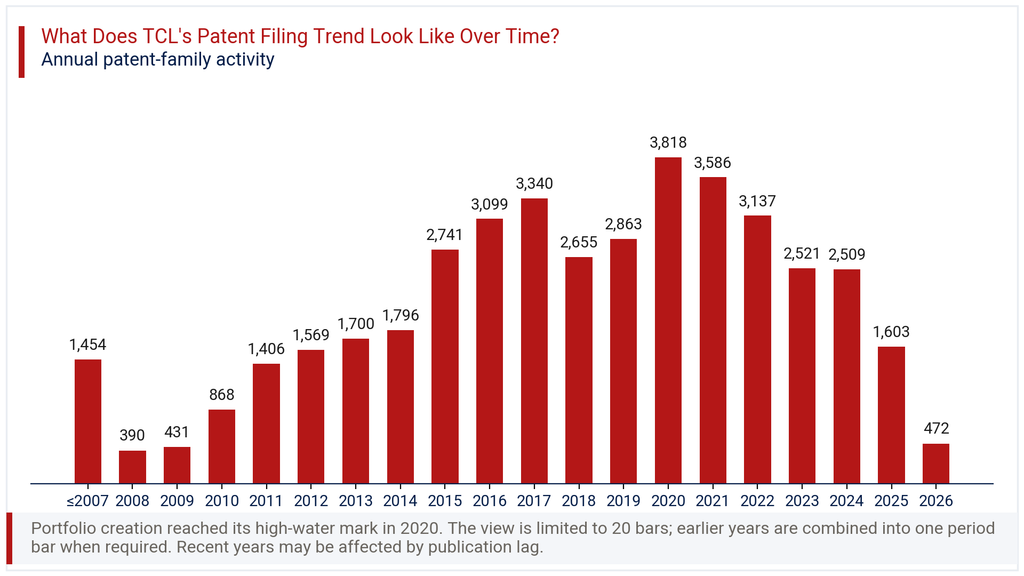
The most recent years need careful reading. The year-on-year change for the latest period shows a drop of 70.6%, but this number is heavily shaped by publication lag rather than a genuine collapse in filing activity. Patent applications typically take many months, sometimes years, to appear in public databases. The figures for 2025 and 2026 are therefore incomplete snapshots, not finished totals. Viewed over the full decade, TCL’s filing trend still reflects a company that scaled its protection activity considerably through the mid-2010s before settling into a more measured, though still substantial, annual filing rhythm in recent years.
Where Does the TCL Patent Portfolio Prioritize Patent Protection?
China anchors TCL’s patent geography by a wide margin, accounting for 98.0% of all filings in this portfolio. This is consistent with a company headquartered in Guangdong province that runs much of its manufacturing and R&D domestically. The geographic chart in this section makes the scale of that concentration immediately visible against every other jurisdiction tracked.
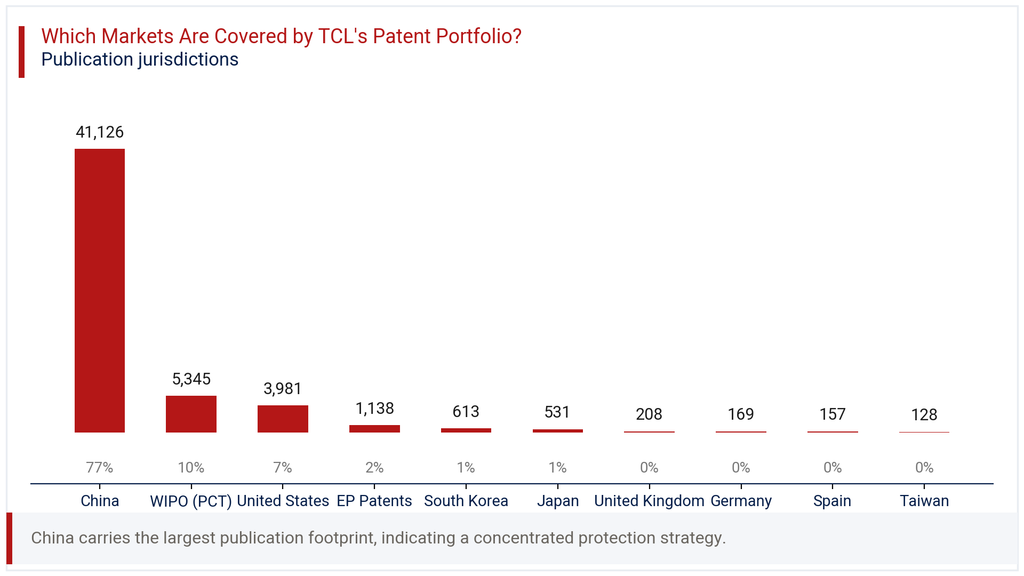
Beyond China, filing activity thins out quickly. The WIPO route under the PCT system covers 12.7% of families, often a precursor to later national filings elsewhere. The United States follows at 9.5%, European patents at 2.7%, and South Korea at 1.5%. Japan, the United Kingdom, Germany, Spain, and Taiwan round out the remaining jurisdictions, each under 1.5% individually. This pattern suggests TCL treats China as its primary protection base, using international filings selectively for markets where it sees direct commercial exposure. For competitors or partners assessing freedom to operate, this means the heaviest enforcement risk sits within China, with comparatively lighter but still meaningful coverage across the US, Europe, and parts of Asia.
Where is the TCL Patent Portfolio Building Protection Across Key Technologies?
TCL’s technology filings cluster around a handful of clearly dominant areas. Digital data processing under G06F leads with 5,517 families, representing 17.2% of the portfolio. Image and video processing under H04N follows at 4,797 families, or 14.9%, closely tied to TCL’s television and display business. Optical control devices under G02F add 4,140 families at 12.9%, reinforcing the display technology focus visible across the portfolio.
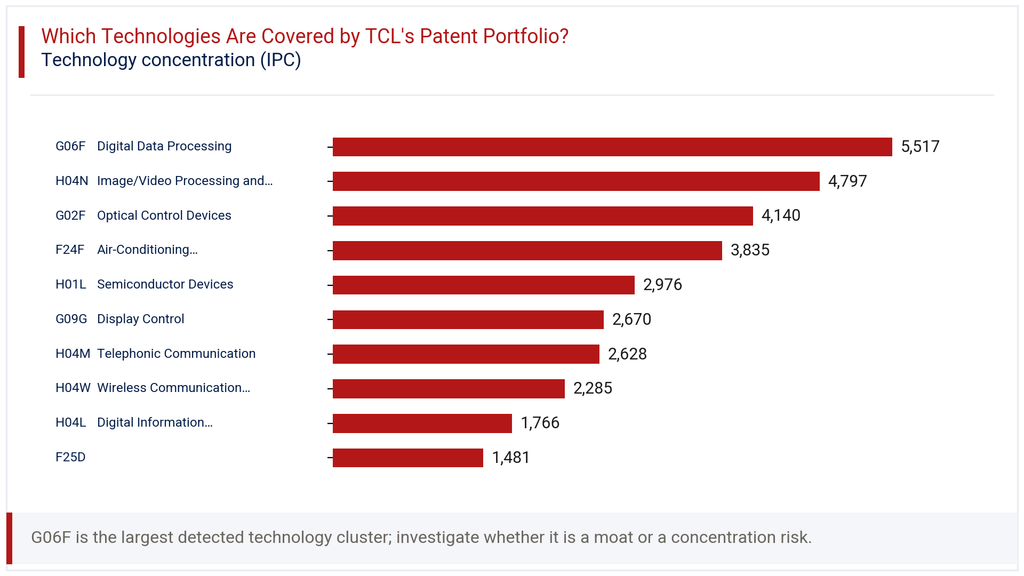
Air conditioning and humidification technology under F24F holds 3,835 families, or 11.9%, reflecting TCL’s appliance manufacturing line. Semiconductor devices under H01L contribute 2,976 families at 9.3%, and display control under G09G adds 2,670 families at 8.3%. Telephonic communication, wireless networks, and digital transmission technologies round out the remaining clusters, each between 5.5% and 8.2%. The technology chart in this section lays out this distribution across all ten IPC categories tracked. This IPC analysis confirms that display and imaging technologies, paired with home appliance engineering, form the backbone of TCL’s filing priorities, mirroring its core consumer electronics and display panel businesses.
How Has the TCL Patent Portfolio Evolved Across Filing Geographies?
Looking at filing activity by year and jurisdiction together reveals how TCL’s international footprint has shifted. China’s filings tracked the overall portfolio trend closely, rising from 2,687 in 2015 to a high of 3,819 in 2020, before easing to 2,384 by 2024. The heatmap in this section shows this pattern alongside every other tracked jurisdiction for direct comparison.
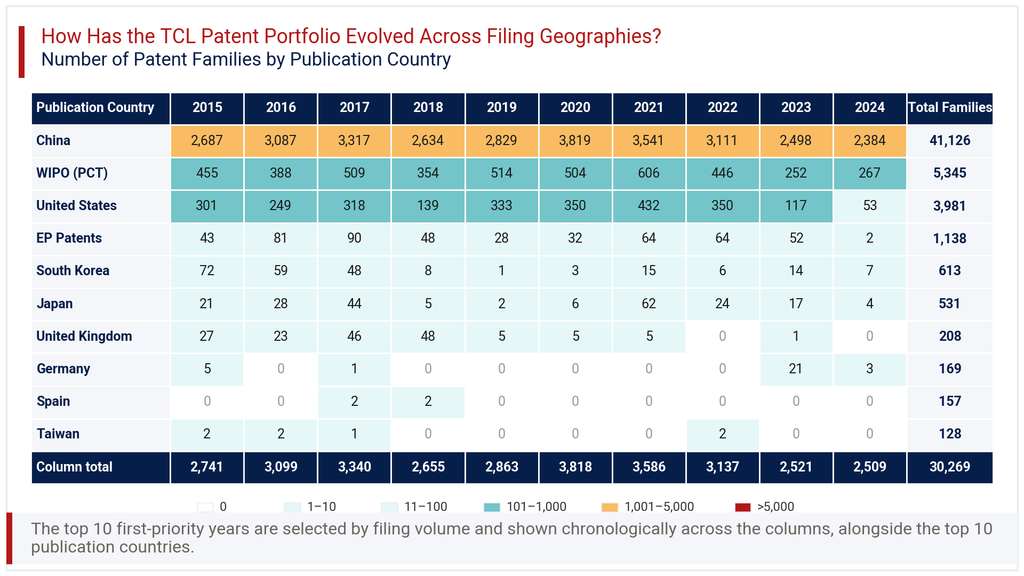
International filings tell a more uneven story. United States filings rose to 432 in 2021 but fell sharply to 53 by 2024. WIPO PCT filings followed a similar arc, peaking at 606 in 2021 before dropping to 267 in 2024. European filings stayed modest throughout, never exceeding 90 in any single year. South Korea and Japan both show declining activity after 2017, with Japan briefly spiking to 62 in 2021. Germany appears almost dormant until a small uptick of 21 filings in 2023. This geographic pattern suggests TCL concentrated international filing pushes around specific years, likely tied to product launches or market entry decisions, rather than maintaining steady year-on-year growth abroad.
Consultant’s Perspective on TCL Patent Portfolio
From an advisory standpoint, the TCL Patent Portfolio reflects a company that treats China as its core protection base while filing abroad in a measured, opportunistic manner. The 98.0% concentration in China is not unusual for a Chinese electronics manufacturer, but it does mean that competitors outside China face comparatively lighter direct patent exposure from TCL. The 44.3% grant rate and 58.9% active rate suggest a portfolio that is reasonably well maintained, though the combined lapsed and revoked share deserves closer scrutiny before any licensing or acquisition conversation.
The technology concentration around display, imaging, and appliance engineering lines up closely with TCL’s commercial businesses, which is a reassuring sign of coherence between R&D spend and filing behaviour. The apparent drop in recent filing years is largely a data lag artifact rather than a genuine retreat from innovation activity. My recommendation for any party evaluating this portfolio commercially is to pull family-level detail on the top IPC clusters, particularly G06F and H04N, and to confirm current legal status before relying on aggregate figures. Portfolio-level data is a strong starting signal, but it cannot replace targeted due diligence on specific assets relevant to your use case.
Explore Deeper Insights with Expertlancing Research
This overview only scratches the surface of what a detailed patent study can reveal. Expertlancing Research helps clients go further, with family-level validation, competitor benchmarking, and technology white space analysis tailored to specific business questions. Whether you are assessing licensing opportunities, tracking a competitor, or scoping a new market entry, our team can build the analysis around your exact needs. Reach out to Expertlancing Research to commission a deeper, decision-ready review of TCL’s patent activity or any other company you are evaluating.