


The Tianma Patent Portfolio offers a useful lens into how one of China’s largest display technology makers protects its innovation pipeline. Across 22,165 total patent families, 74.5% remain active, a figure that covers both granted and pending cases still in force. Of these, 12,503 families have been granted outright, while 4,010 sit in pending status awaiting examination outcomes. The grant rate stands at 56.4%, a reasonable conversion level for a portfolio of this size. On the other side of the ledger, 5,652 families have exited active status through lapse, revocation, or expiry combined. These figures reflect prosecution and maintenance outcomes only, not a verdict on patent quality or enforceability.
Filing activity tells its own story. The portfolio peaked in 2023, when Tianma filed 1,970 new families, capping years of steady expansion. China dominates the jurisdictional footprint, accounting for 99.2% of filings, and the company’s patents span 10 jurisdictions in total. On the technology side, optical control systems lead the way, with the IPC class G02F Optical Control Devices contributing 4,183 families, the single largest cluster in the portfolio.
This report is built to help readers understand the shape and direction of the Tianma Patent Portfolio, not to pass judgment on commercial outcomes. Filing volume alone does not confirm product success, market leadership, or competitive advantage in any given segment. Readers considering business or investment decisions around specific technologies should independently verify the relevant patent families. What follows is a structured read of legal status, filing trends, geographic spread, technology focus, and how these dimensions intersect over time.
About Tianma
Company Profile: Tianma Microelectronics Co., Ltd. is a Shenzhen-based display solutions provider. The company was established in 1983 and publicly listed on the Shenzhen Stock Exchange in 1995. Tianma provides leading technology and quality displays to consumer, industrial, and automotive industries, used in smartphones, tablet PCs, smart wear, automotive instrumentation, industrial and medical instrumentation, avionic display, household appliances, home automation, office equipment, and rear seat entertainment.
Tianma focuses on mobile intelligent terminal and professional display markets, expanding into home automation, smart wear, AR, VR, UAV and charging facilities, and provides custom-designed display solutions to thousands of medium-high end customers.
Tianma’s shipments of small and medium size modules keep a leading position among global display manufacturers, with market share for high-end medical devices, aviation entertainment, navigation and VOIP products ranked first worldwide. The company operates manufacturing facilities across Shenzhen, Shanghai, Chengdu, and Wuhan, alongside subsidiaries in Japan, the US, and Europe.
How Healthy is Tianma Patent Portfolio?
Patent portfolio health depends on how many families remain legally enforceable versus how many have fallen away. For Tianma, 56.4% of families sit in granted status, with another 18.1% pending examination, together producing the 74.5% active rate cited earlier. That leaves a meaningful share, 12.5% lapsed, 8.8% revoked, and 4.2% expired, which together represent families no longer offering protection. The composition chart in this section shows this split clearly, and it points to a portfolio where the bulk of filed inventions have either secured rights or remain in the examination queue.
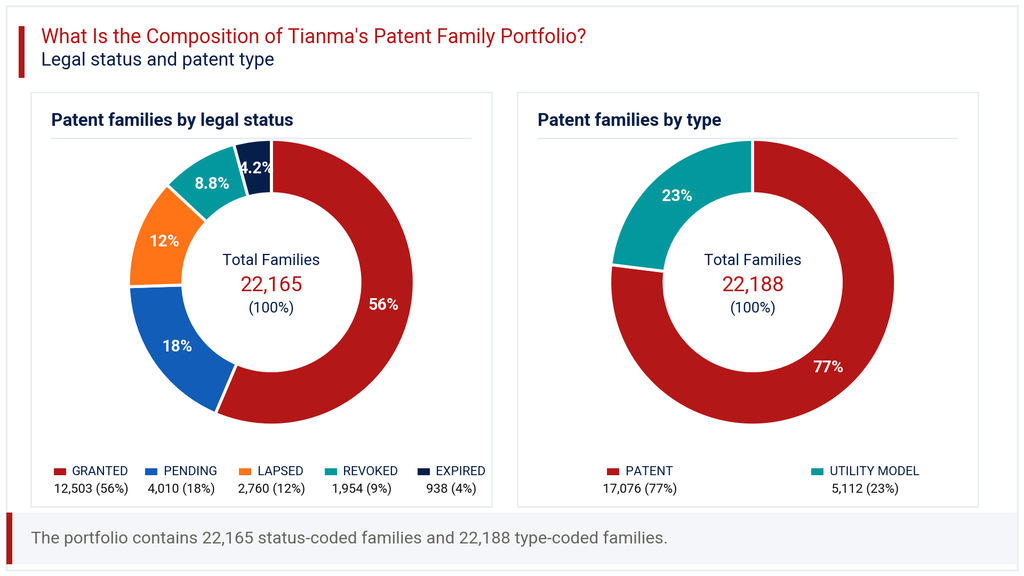
On patent type, 77.0% of the portfolio consists of standard invention patents, while 23.0% are utility models. This mix suggests Tianma pursues full invention protection as its primary route, reserving utility models for faster, narrower protection on incremental improvements. A portfolio weighted this heavily toward invention patents typically signals deeper R&D investment, since these filings face stricter examination standards than utility models. The revoked and lapsed share, while not alarming at this scale, warrants periodic review to understand which technology areas see the highest attrition. Taken together, the legal status profile points to a portfolio in reasonably sound shape, with active protection outweighing lapsed or revoked rights by a wide margin.
How Has the Tianma Patent Portfolio Evolved Over Time?
Patent filing trends at Tianma show a clear arc of acceleration followed by a recent plateau. Filings rose from just 107 in 2008 to 844 by 2015, then nearly doubled to 1,525 in 2016. This marks a distinct inflection point, likely tied to expanded R&D spending as Tianma scaled its display technology business. Volumes stayed strong through 2022 (1,960) and 2023 (1,970), the portfolio’s peak year, before easing slightly to 1,938 in 2024.
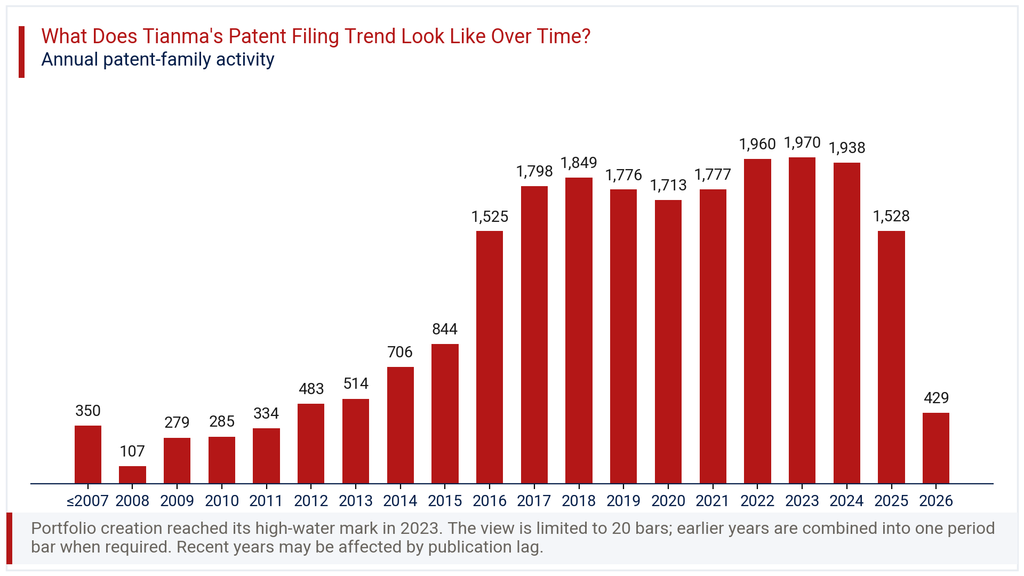
The filing-trend chart in this section shows 2025 figures at 1,528 and 2026 at just 429, a drop reflected in the latest_year_change_pct of -71.9%. This should not be read as a genuine collapse in innovation activity. Patent applications typically take 12 to 18 months to publish, so recent filing years are structurally undercounted until records catch up. The more reliable signal is the sustained plateau between 2019 and 2024, where annual filings consistently exceeded 1,700, indicating a mature, steady-state filing programme rather than one in decline.
Where Does the Tianma Patent Portfolio Prioritize Patent Protection?
Patent geography for Tianma is overwhelmingly domestic. China accounts for 99.2% of all filings, underscoring the company’s home market as its primary innovation and protection base. The United States follows as the leading overseas jurisdiction, representing 15.5% of filings, a notable gap but still the clearest signal of international ambition. Germany (2.4%), Japan (2.3%), and WIPO PCT filings (1.7%) round out the next tier of activity.
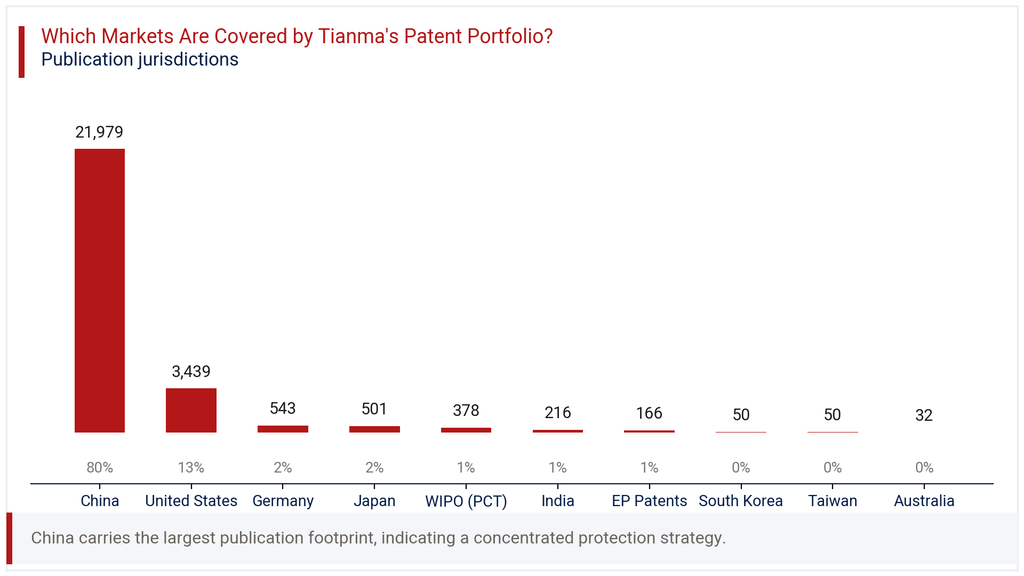
The geographic chart in this section shows a long tail beyond these markets, including India (1.0%), European Patents (0.7%), South Korea (0.2%), Taiwan (0.2%), and Australia (0.1%). Across all these markets combined, Tianma’s patents span 10 jurisdictions. This pattern is typical of a Chinese manufacturer whose core production and customer base remain domestic, while selective overseas filing protects key export markets like the US. The relatively thin coverage elsewhere suggests Tianma treats international filing as a targeted exercise, concentrated where its automotive and consumer display customers have real commercial exposure, rather than a broad global filing strategy.
Where is the Tianma Patent Portfolio Building Protection Across Key Technologies?
IPC analysis of the Tianma Patent Portfolio reveals a clear concentration in display-specific optics and electronics. G02F Optical Control Devices leads with 4,183 families (20.6%), followed closely by G09G Display Control at 4,002 families (19.7%). Together these two classes account for roughly 40% of all technology filings, confirming that core display driving and optical modulation remain Tianma’s central research focus.
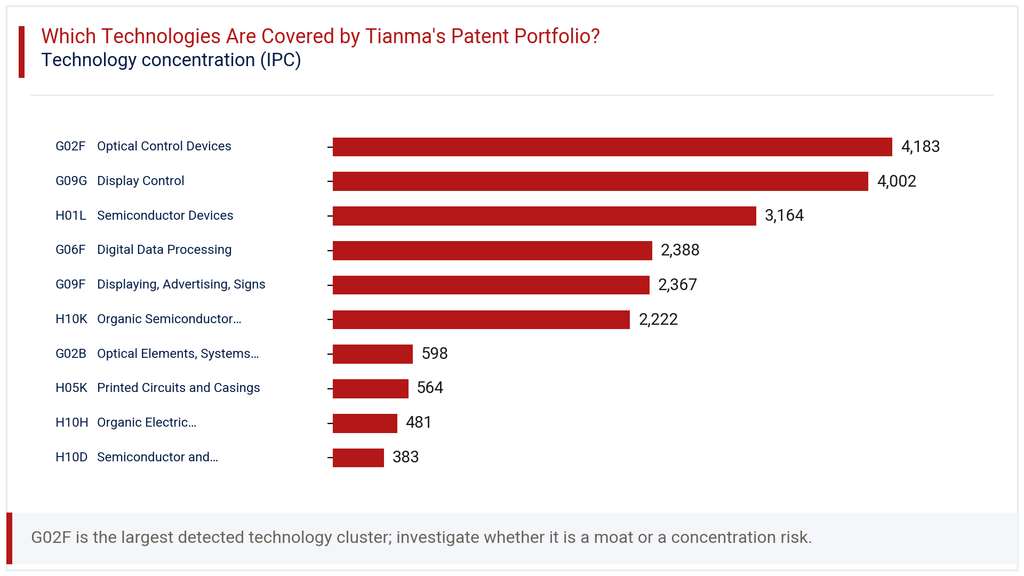
Semiconductor technology also features prominently, with H01L Semiconductor Devices contributing 3,164 families (15.5%). The technology chart in this section also highlights G06F Digital Data Processing (2,388, 11.7%) and G09F Displaying, Advertising, Signs (2,367, 11.6%), both tied to how display modules integrate with broader electronic systems. Notably, H10K Organic Semiconductor Devices, covering OLED technology, holds 2,222 families (10.9%), signaling meaningful investment in next-wave display materials beyond traditional LCD approaches. Smaller clusters in optical elements, printed circuits, and organic solid-state devices round out a technology base that is deep in display fundamentals but increasingly stretching into adjacent semiconductor and materials science territory.
How Has the Tianma Patent Portfolio Evolved Across Filing Geographies?
Viewing filing geography by year adds texture to the jurisdictional story. China’s filings tracked the overall portfolio trend closely, rising from 1,462 in 2016 to a peak of 1,965 in 2023, before easing to 1,520 in 2025. The heatmap in this section shows United States filings following a similar but smaller arc, climbing from 195 in 2016 to 366 in 2023, then dropping sharply to 91 in 2025, again likely a publication lag effect rather than a real pullback.
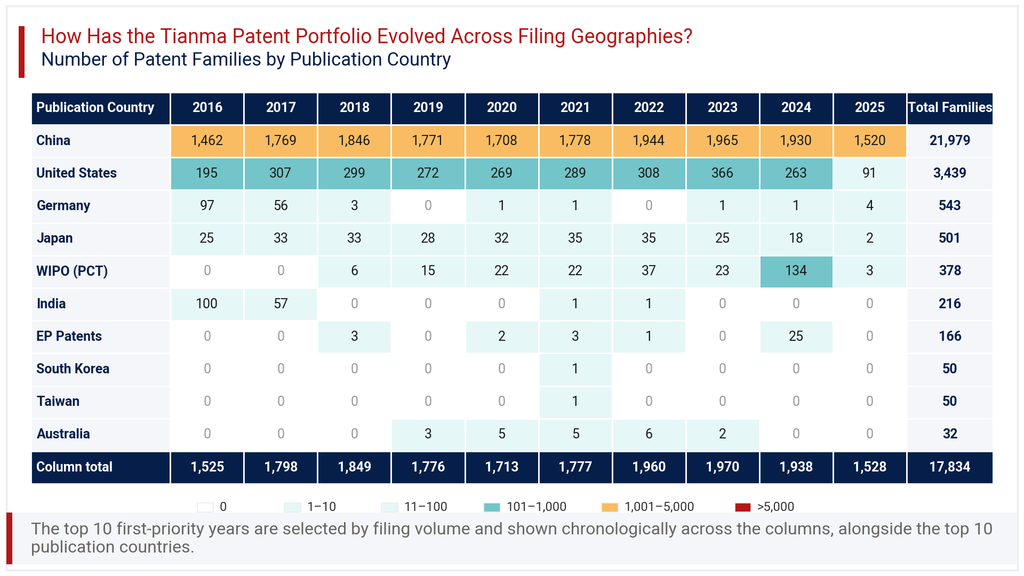
Germany and India show a different pattern entirely. Germany’s filings were meaningful in 2016 (97) and 2017 (56) but fell to near zero afterward. India followed a near-identical path, with 100 filings in 2016 and 57 in 2017, then effectively nothing since 2018. WIPO PCT filings, by contrast, emerged later and grew, reaching 134 in 2024, suggesting a shift toward international treaty filings as a more efficient route to multi-country protection. This changing mix across jurisdictions points to a portfolio strategy that has matured and adapted its international filing channels over the past decade.
Consultant’s Perspective on Tianma Patent Portfolio
Reading the Tianma Patent Portfolio as a whole, the picture is one of a domestically anchored but technically focused filer. The company’s 22,165 families, concentrated heavily in optical control and display driving technologies, reflect a business that treats patenting as core to its display manufacturing strategy rather than a peripheral legal exercise. The 56.4% grant rate and 74.5% active rate suggest a portfolio under reasonably disciplined management, not one accumulating dead weight.
What stands out most is the geographic imbalance. With 99.2% of filings in China and only a thin international layer, Tianma’s protection strategy still trails its stated ambitions in automotive, AR, VR, and overseas markets. Businesses evaluating Tianma as a competitor, licensing partner, or acquisition target should look closely at how OLED-related filings under H10K develop, since this cluster signals where the company is placing its next-generation display bets. Expanding PCT and US filings in recent years hints at growing international intent. Any party assessing competitive risk from the Tianma Patent Portfolio should track whether this internationalization continues or stalls, as it will shape how enforceable Tianma’s rights become outside China.
Explore Deeper Insights with Expertlancing Research
This overview of the Tianma Patent Portfolio highlights where the company concentrates its innovation and protection efforts, but real business decisions need sharper detail. Expertlancing Research helps clients validate specific patent families, assess freedom-to-operate risk, and benchmark competitors across jurisdictions. Whether you are evaluating a licensing opportunity, tracking a competitor’s R&D direction, or preparing for market entry, our analysts can build the detailed intelligence you need. Reach out to Expertlancing Research to commission a customized patent analysis built around your specific business question.