


The Tongding Patent Portfolio spans 2257 patent families, offering a window into how this cable and optical component manufacturer protects its engineering work. Of these families, 38.2% remain active today, a figure covering both granted and pending cases. The portfolio holds 721 granted patents and 142 pending applications, with a grant rate of 31.9%. Alongside these, 1394 families have moved into lapsed, revoked, or expired status combined. These numbers describe prosecution and maintenance outcomes only, not a verdict on patent quality or enforceability.
Filing activity peaked in 2021, when Tongding filed 259 patent families, the highest single-year count in the data. China dominates the filing geography, accounting for 100.0% of jurisdictional share across 4 jurisdictions tracked. On the technology side, H01B (electric cables and conductors) leads the portfolio with 574 families, making it the single largest cluster by far. This concentration tells a story of a company building depth in its core cable manufacturing competence rather than spreading thin.
This report draws on patent family counts, legal status, and classification data to map how Tongding has built its protection strategy over time. Filing volume alone does not confirm commercial success or a lasting competitive edge in the market. Readers evaluating specific families for licensing, litigation, or investment decisions should verify details independently before relying on them. What follows breaks the portfolio down by health, timeline, geography, and technology focus.
About Tongding
Company Profile: Tongding Interconnection Information Co., Ltd. is a core subsidiary of Tongding Group, based in Wujiang, Jiangsu, China. It is located in Wujiang, one of the cable industrial bases under China Torch Program, on the boundary of Jiangsu, Zhejiang and Shanghai.
The company specializes in research and development, manufacturing, marketing and engineering service for optical fiber, optical and electric communication cable, railway signal cable, RF coaxial cable, special optical cable and electric cable. It went public on the Shenzhen Stock Exchange in October 2010, opening a new phase of growth. Its product range includes fiber optic cable, copper cable, and ODN components, serving telecom operators and infrastructure projects.
The company operates as part of a larger group structure with manufacturing bases concentrated in the Yangtze River Delta region. Independently verifiable revenue or recent R&D disclosures were not found on the official site during this research.
How Healthy is Tongding Patent Portfolio?
Patent portfolio health for Tongding presents a mixed picture when viewed through legal status. Granted patents make up 31.9% of all families, while pending cases add another 6.3%, giving the 38.2% active rate cited earlier. On the other side, lapsed families account for 31.6%, revoked ones for 17.6%, and expired ones for 12.5%. The composition chart in this section shows these categories side by side, and the split between active and inactive status is close to even.
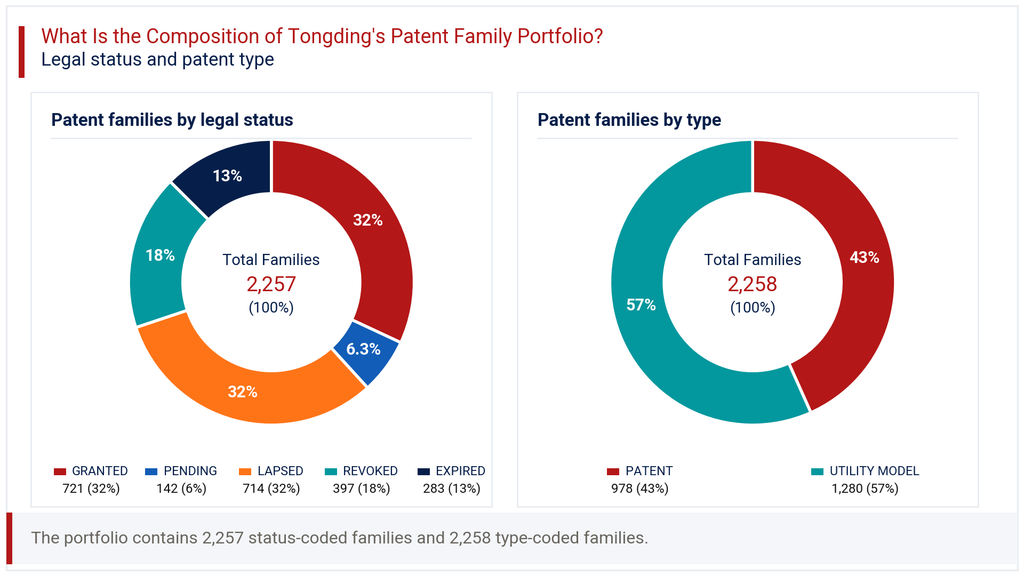
This near-even balance suggests a portfolio that has gone through significant pruning over the years, whether through deliberate abandonment or renewal lapses. Looking at patent type, Utility Models represent 56.7% of filings against 43.3% for standard invention patents. This tilt toward Utility Models is common among Chinese manufacturers, since these filings grant faster and suit incremental engineering improvements well. For Tongding, this pattern fits a business built on cable and optical component manufacturing, where iterative design tweaks matter more than foundational breakthroughs. The legal status mix, taken together with patent type, points to a portfolio oriented toward practical protection rather than broad defensive coverage. Buyers or partners assessing this patent legal status profile should expect a working, not exhaustive, protection net.
How Has the Tongding Patent Portfolio Evolved Over Time?
Patent filing trends for Tongding show a long build-up followed by a recent pull-back. Filings rose from just 10 in 2008 to 104 in 2012, then climbed steadily through the mid-2010s. The portfolio reached its high point in 2021 with 259 families filed in a single year, following strong years in 2019 (205) and 2020 (238). The filing-trend chart in this section traces this rise clearly across more than a decade.
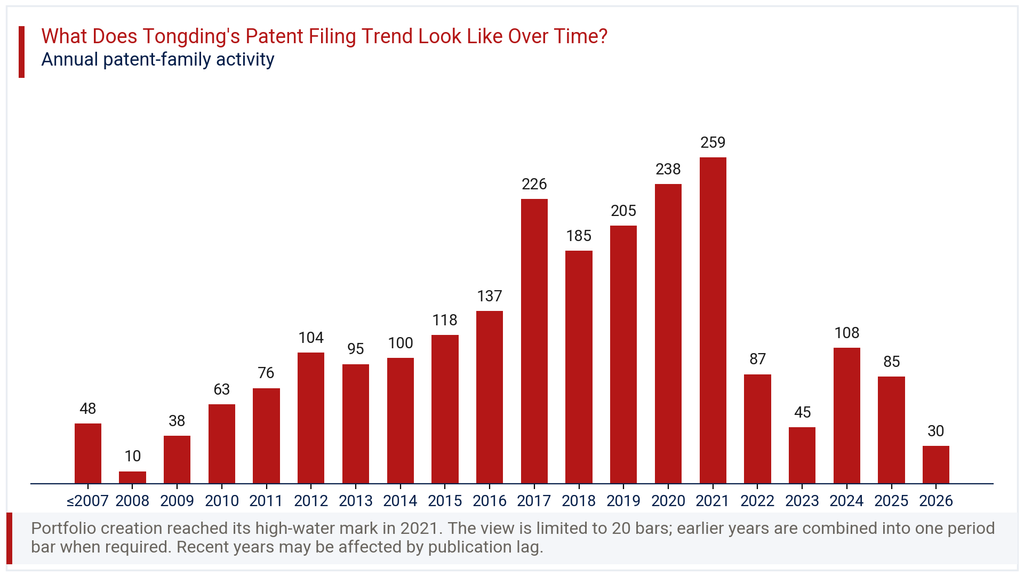
After 2021, filings dropped sharply, falling to 87 in 2022 and further to 45 in 2023, before a partial rebound to 108 in 2024. The 2025 count of 85 and a change of -64.7% in the latest year reflect this decline, but publication lag likely explains much of it. Patent applications typically take twelve to eighteen months to appear in public records, so the most recent one to two years understate actual filing activity. Reading the 2022 to 2025 dip as a genuine retreat from innovation would be premature. The more reliable signal is the sustained, multi-year climb through 2021, which marks a genuine high-investment period for Tongding’s engineering teams.
Where Does the Tongding Patent Portfolio Prioritize Patent Protection?
Patent geography for Tongding is heavily concentrated in a single market. China accounts for 100.0% of jurisdictional share by family count, hosting the overwhelming bulk of all filings. The geographic chart in this section shows just how dominant this home market focus is relative to other jurisdictions tracked. Beyond China, the portfolio includes small footholds: WIPO (PCT) filings at 1.9%, United States filings at 0.2%, and EP Patents at 0.1%.
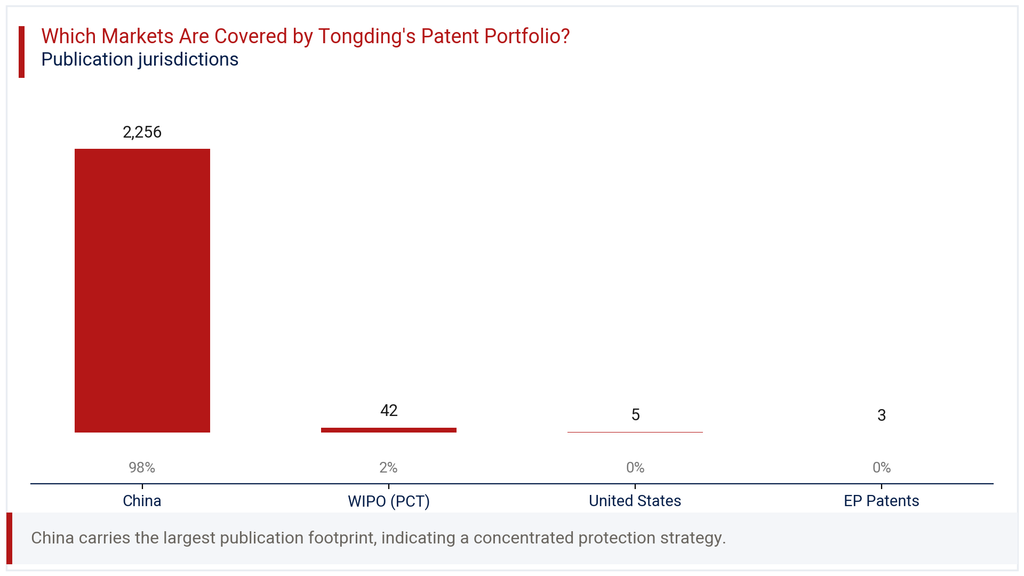
This pattern signals a company whose intellectual property strategy centers almost entirely on protecting its domestic manufacturing and supply position. The minimal international filing, just 42 PCT applications, 5 US filings, and 3 EP filings, suggests limited current ambition to assert patent rights abroad. For a company serving telecom operators and infrastructure projects primarily within China, this concentration makes commercial sense. It does carry a risk, though: competitors operating in the US or European Union markets face little to no patent barrier from Tongding’s current protection. Companies evaluating Tongding as a supplier or technology partner outside China should factor in this limited cross-border patent coverage when assessing competitive exposure.
Where is the Tongding Patent Portfolio Building Protection Across Key Technologies?
IPC analysis of the Tongding Patent Portfolio reveals a clear technology hierarchy. H01B, covering cables, conductors and insulated wires, leads with 574 families, or 34.1% of classified filings. Close behind sits G02B, optical elements, systems and instruments, with 527 families representing 31.3% of the total. Together these two classes account for nearly two thirds of all technology-tagged filings. The technology chart in this section lays out this distribution across all ten major IPC classes tracked.
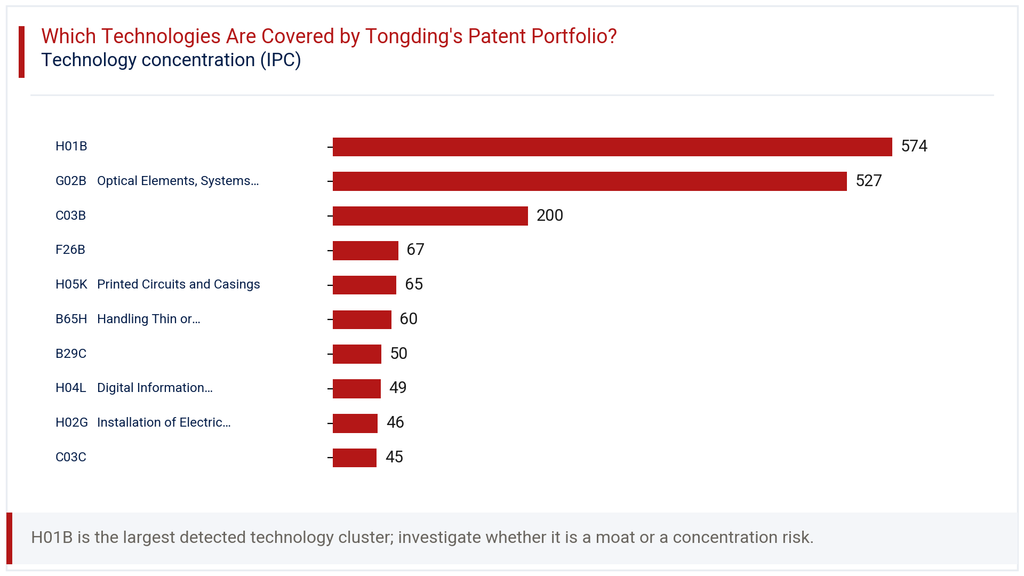
Further down the list, C03B (glass manufacturing processes, relevant to fiber optic production) holds 200 families at 11.9%. Smaller clusters include F26B (drying technology) at 4.0% and H05K (printed circuits and casings) at 3.9%. This spread confirms that Tongding’s research effort concentrates on the physical materials and construction of cables and optical fiber, rather than on digital or software-adjacent innovation. The presence of H04L (digital information transmission) at only 2.9% suggests a company primarily focused on hardware infrastructure, not data systems. For competitors or investors, this technology mix confirms Tongding’s identity as a materials and manufacturing-first business, not a network technology or software company.
How Has the Tongding Patent Portfolio Evolved Across Filing Geographies?
The heatmap view of filings by year and country reinforces the geographic concentration already noted. China shows a consistent filing presence across every tracked year, rising from 104 in 2012 to a peak of 259 in 2021, then falling to 108 by 2024. This pattern mirrors the overall portfolio trend almost exactly, confirming that China drives nearly all of the filing activity across the entire timeline.
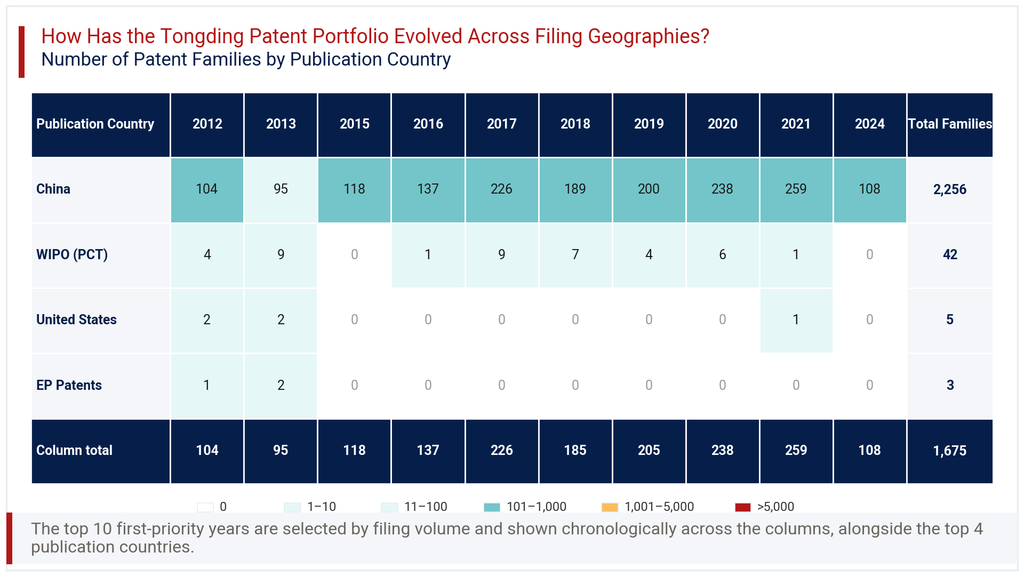
International filings, by contrast, appear only sporadically and in small numbers. WIPO (PCT) filings peaked at 9 in both 2013 and 2017, but dropped to 0 by 2024. United States filings never exceeded 2 in any year, last appearing in 2021 with just 1 filing. EP Patents filings stopped entirely after 2013, with 2 filings that year being the final recorded entries. This heatmap pattern shows that whatever international ambition existed around 2012 to 2017 has not been sustained. The data suggests any cross-border patent strategy Tongding once pursued has effectively paused, leaving China as the sole active filing jurisdiction in recent years.
Consultant’s Perspective on Tongding Patent Portfolio
Viewed as a whole, the Tongding Patent Portfolio tells a story of focused, domestically-oriented innovation in cable and optical fiber manufacturing. The heavy weighting toward H01B and G02B classes confirms a company that invests in its core competence rather than diversifying broadly. The near-total concentration in China, at 100.0% of filings, is consistent with a manufacturer whose customer base and production footprint sit largely within the country.
The legal status split, with 38.2% of families still active, calls for some caution. A portfolio this evenly divided between active and lapsed or revoked status may reflect routine pruning, but it also means a meaningful share of past innovation no longer carries legal protection. Buyers, partners, or competitors assessing this Tongding Patent Portfolio should look closely at which specific families remain enforceable today, rather than relying on aggregate counts. The apparent filing decline after 2021 likely overstates any real slowdown, given publication lag effects. My recommendation: any party considering a licensing, acquisition, or competitive response involving Tongding should commission a family-level legal status check before drawing conclusions. Aggregate trends offer direction, not certainty.
Explore Deeper Insights with Expertlancing Research
This overview only scratches the surface of what a full patent analysis can reveal about Tongding’s technology direction and competitive positioning. Expertlancing Research helps clients go further, with family-level validation, competitor benchmarking, and custom technology landscape studies. If you are evaluating Tongding as a supplier, competitor, or acquisition target, our team can build the detailed intelligence you need. Reach out to Expertlancing Research to commission a tailored patent study suited to your specific business question.