


The vivo Patent Portfolio offers a clear window into how one of China’s largest smartphone makers protects its engineering work. Across 36,650 total patent families, 80.2% remain active, a figure covering both granted and pending cases. Of this total, 19,178 families have been granted and 10,209 are still pending examination. The grant rate stands at 52.3%, a reasonable outcome for a portfolio of this scale. A combined 7,263 families fall into lapsed, expired or revoked categories. These figures reflect prosecution and maintenance outcomes only, not a verdict on patent quality or enforceability.
Filing activity peaked in 2021, when vivo filed 5,082 patent families in a single year, the highest point in its filing history. China dominates the jurisdictional spread, accounting for 98.4% of filings, and the company has filed across 10 jurisdictions tracked in this analysis. The leading technology cluster is G06F (Digital Data Processing), with 10,105 families, ahead of wireless communication and telephony categories. This concentration suggests a filing strategy anchored firmly in home-market protection with selective international expansion.
This report is built to help business readers, IP teams and investors assess the shape and depth of vivo’s patent activity. Filing counts alone cannot confirm commercial success, product differentiation or competitive strength in any market. Readers should treat this as a directional view rather than a substitute for detailed legal diligence. Anyone relying on specific families for transactional or competitive decisions should verify status directly with the relevant patent office.
About vivo
Company Profile: Vivo Mobile Communication Co., Ltd., operating as vivo, is a Chinese multinational technology company headquartered in Dongguan, Guangdong, that designs and develops smartphones, smartphone accessories, software, and online services. The company develops software for its phones, distributed through its V-Appstore, using Origin OS in mainland China and the now-discontinued Funtouch OS elsewhere.
It operates 10 R&D centers across Shenzhen, Dongguan, Nanjing, Beijing, Hangzhou, Shanghai, Xi’an, Taipei, Tokyo, and San Diego. Since its 2009 founding, vivo has expanded globally, serving over 400 million users across more than 60 countries and regions. In December 2020, vivo and Zeiss announced a long-term strategic partnership to develop mobile imaging technology, first featured in the vivo X60 series. The company’s X200 series, launched in October 2024, continues this imaging collaboration. Vivo had 40,000 employees as of 2022.
Its subsidiaries include iQOO and Jovi.
How Healthy is vivo Patent Portfolio?
Patent portfolio health depends on how many families remain legally active versus those that have lapsed or been revoked. vivo’s patent portfolio shows 52.3% of families granted, with another 27.9% still pending. Together these account for the 80.2% active rate referenced earlier. On the weaker side, 16.2% of families have been revoked, 2.8% lapsed, and 0.9% expired. The composition chart in this section illustrates this split clearly, showing a portfolio tilted toward granted protection rather than unresolved applications.
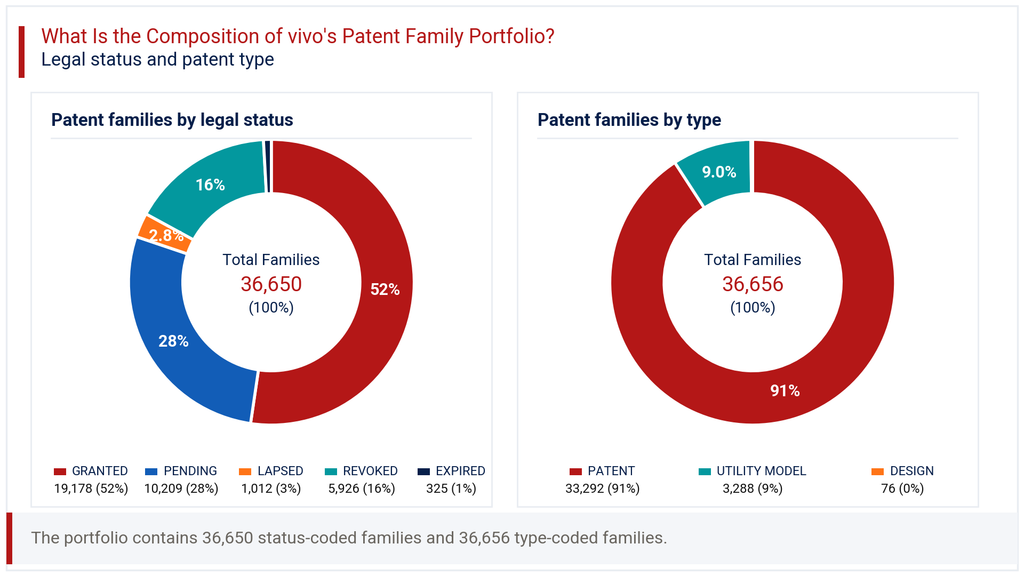
Looking at patent type, standard patents make up 90.8% of the portfolio, utility models 9.0%, and design filings a marginal 0.2%. This distribution signals that vivo pursues substantive technical protection far more than incremental utility model filings, which are common among Chinese electronics firms seeking faster, cheaper registration. The low design share suggests device aesthetics are not a primary IP focus compared to functional and software innovation. A revoked share of 16.2% deserves attention, as it may reflect opposition activity or validity challenges in contested technology areas. For a portfolio this size, the overall balance points to reasonably disciplined patent prosecution rather than defensive mass filing without follow-through.
How Has the vivo Patent Portfolio Evolved Over Time?
Patent filing trends for vivo show a sharp climb starting in 2015, when filings jumped to 560 from just 90 the year before. Growth accelerated through 2016 at 1,783 and continued rising until it peaked in 2021 at 5,082 families. The filing-trend chart in this section traces this arc, highlighting a company that scaled its IP activity in step with its global smartphone expansion. This period aligns with vivo’s broader push into camera technology, 5G connectivity and international markets.
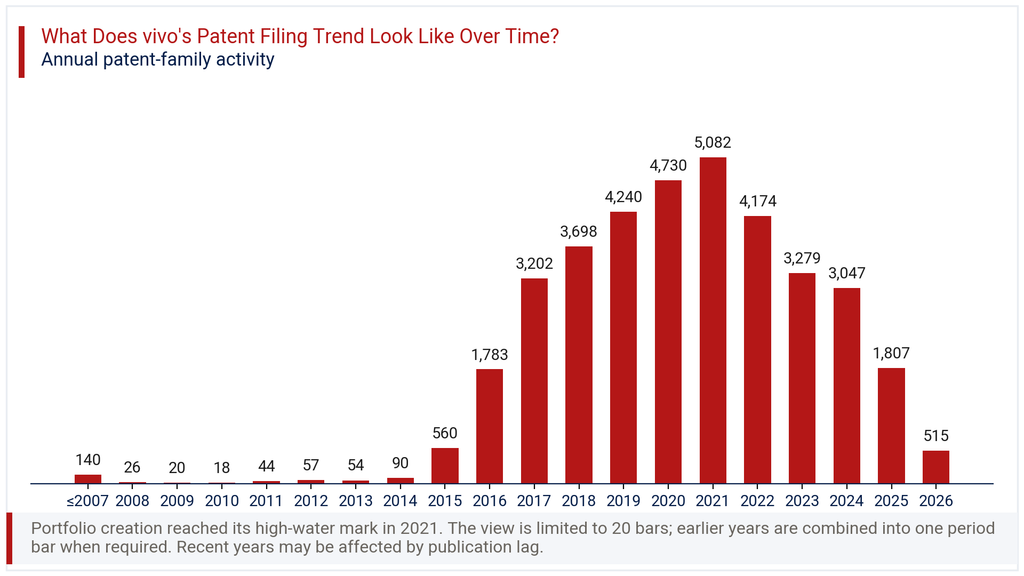
After 2021, filings declined year over year, falling to 4,174 in 2022 and further to 3,047 by 2024. The 2025 figure of 1,807 and the -71.5% change recorded for the latest year should not be read as a sudden retreat from innovation. Patent applications typically take many months to appear in public databases after filing, so recent years are understated by publication lag rather than genuine inactivity. The real signal lies in the sustained high-filing years between 2017 and 2022, which represent a settled, mature research output.
Where Does the vivo Patent Portfolio Prioritize Patent Protection?
Patent geography for vivo is heavily concentrated at home. China accounts for 98.4% of all filings, underscoring a portfolio built primarily to protect domestic manufacturing and sales operations. The geographic chart in this section shows a steep drop-off after China, with WIPO PCT filings next at 26.0%, a route companies use to preserve international filing options before committing to specific countries.
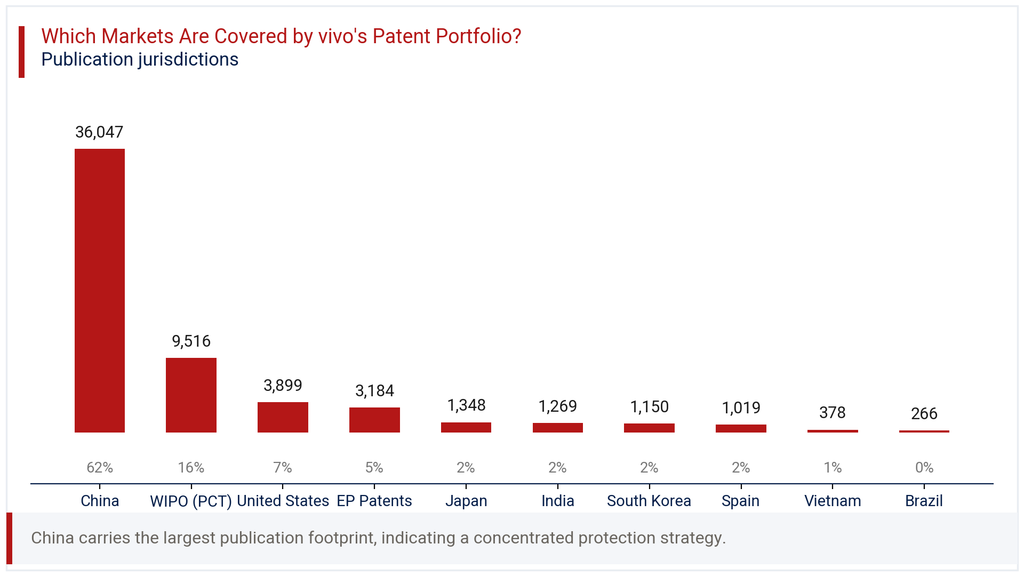
Beyond China and PCT applications, the United States holds 10.6% share, followed by EP Patents at 8.7% and Japan at 3.7%. India, South Korea, Spain, Vietnam and Brazil each contribute smaller shares, ranging from 3.5% down to 0.7%. This spread suggests vivo pursues protection in major smartphone markets and key manufacturing or export destinations, rather than filing broadly everywhere. The limited presence in Vietnam and Brazil, both growing smartphone markets, may reflect a more selective approach to emerging regions. For a business evaluating vivo’s international exposure, the pattern points to calculated market prioritization rather than blanket global filing.
Where is the vivo Patent Portfolio Building Protection Across Key Technologies?
IPC analysis of vivo’s filings reveals a portfolio centered on computing and connectivity. G06F (Digital Data Processing) leads with 10,105 families, representing 24.2% of the total. Close behind sits H04W (Wireless Communication Networks) at 8,177 families and 19.6% share, reflecting heavy investment in mobile network technology. The technology chart in this section shows these two classes well ahead of the rest, forming the technical backbone of vivo’s smartphone platform.
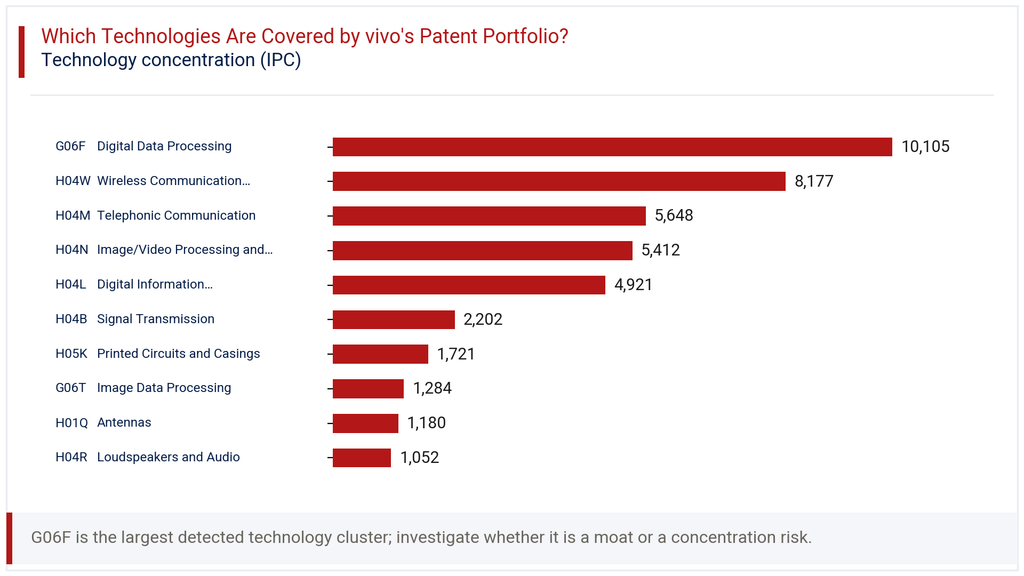
Further down the list, H04M (Telephonic Communication) holds 13.5% share with 5,648 families, while H04N (Image/Video Processing and Display) contributes 13.0% and 5,412 families, a figure consistent with vivo’s known investment in camera and imaging technology. H04L (Digital Information Transmission) adds 11.8% share. Smaller but notable clusters include H05K (Printed Circuits and Casings) and H01Q (Antennas), pointing to hardware-level innovation alongside software. Together, this spread confirms that vivo’s research spans both the software layer and the physical engineering of its devices, a combination fitting its camera-partnership strategy with Zeiss.
How Has the vivo Patent Portfolio Evolved Across Filing Geographies?
The heatmap in this section tracks filing volume by jurisdiction and year, revealing distinct timing patterns. China’s filings grew steadily from 1,776 in 2016 to a peak of 5,054 in 2021, before easing to 3,013 by 2024. This mirrors the overall portfolio trend, since China forms the bulk of all filings. WIPO PCT filings followed a similar arc, rising from just 44 in 2016 to 1,739 in 2021.
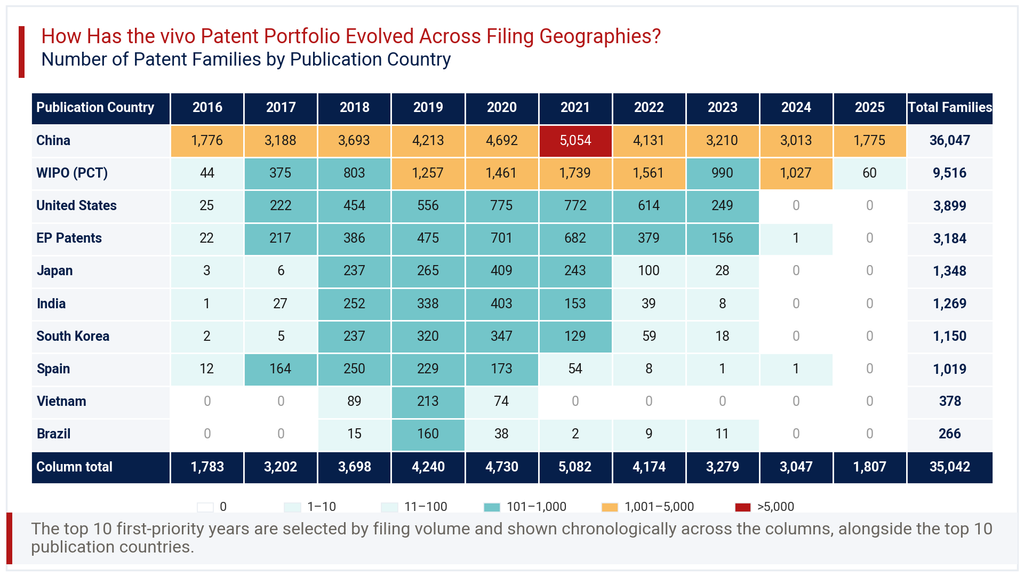
Other jurisdictions show sharper rises and falls. The United States climbed from 25 filings in 2016 to 775 in 2020, then dropped to 0 recorded filings by 2024, a pattern again likely shaped by publication lag rather than withdrawal. Japan, South Korea and India all show similar peaks around 2019 and 2020, followed by declines. Vietnam and Brazil show short, concentrated filing bursts between 2018 and 2020 rather than sustained activity. This year-by-jurisdiction view suggests vivo adjusted its international filing intensity in response to market entry phases, concentrating effort during specific product launch windows rather than filing continuously everywhere.
Consultant’s Perspective on vivo Patent Portfolio
From an advisory standpoint, the vivo Patent Portfolio reflects a company that treats patents as an operational tool tied to product cycles, not a standalone IP strategy. The heavy China concentration at 98.4% makes sense given manufacturing scale, but it does leave questions about depth of protection in markets like Brazil and Vietnam, where filing activity remains thin. A grant rate of 52.3% is respectable, though the 16.2% revoked share is worth tracking over subsequent reporting periods.
The technology mix, led by digital data processing and wireless communication, aligns well with vivo’s camera and connectivity positioning in the market. What stands out is the timing discipline visible in the filing trend data, with activity rising and falling in step with major product launches rather than following a flat annual cadence. This is a pragmatic, resource-conscious approach rather than an aggressive global IP buildout.
Going forward, businesses assessing vivo should watch whether international filings, particularly in the US and EP systems, resume once publication lag clears. A sustained pickup there would signal renewed confidence in contested overseas markets, while continued concentration in China would confirm a primarily domestic-first protection strategy.
Explore Deeper Insights with Expertlancing Research
This overview only scratches the surface of what a detailed patent study can reveal about vivo’s technology direction and competitive posture. Expertlancing Research helps clients go further, with family-level validation, competitor benchmarking and technology-mapping support tailored to specific business questions. Whether you are assessing acquisition targets, licensing opportunities or freedom-to-operate risk, our analysts can build a customized view. Reach out to Expertlancing Research to commission a deeper, decision-ready analysis of this portfolio or any other company you are tracking.