


The Wistron Patent Portfolio spans 8,580 patent families, giving a clear view of how this Taiwan based manufacturer protects its engineering output. An active_rate of 59.3% covers patents that are either granted or still pending before patent offices worldwide. Within this base, 4,445 families have been granted and 645 remain pending, producing a grant rate of 51.8%. A combined 3,490 families sit in lapsed, expired, or revoked status. These figures reflect prosecution and maintenance outcomes only, not a judgment on patent quality or enforceability.
Filing activity peaked in 2012, when Wistron filed 787 patent families, the highest single year recorded. Taiwan leads as the top jurisdiction, holding 69.3% of filings (jurisdictions_pct), and the portfolio spans 10 jurisdictions in total. On the technology side, G06F Digital Data Processing dominates with 3,613 families, confirming computing hardware and software as the company’s core filing area.
This report draws on filing, legal status, and classification patterns to build a picture of Wistron’s patenting behaviour over time. Filing counts alone do not establish commercial success or competitive strength in the market. Readers evaluating specific inventions or asserting rights should independently verify the underlying patent families. The analysis that follows is meant to guide business and research decisions, not to substitute for formal legal or technical due diligence.
About Wistron
Company Profile: Wistron Corporation is a Taiwan based electronics manufacturer headquartered in Taipei. It was the manufacturing arm of Acer Inc. before being spun off in 2000. As an original design manufacturer, the company designs and manufactures products for other companies to sell under their brand name. Wistron products include notebook and desktop computers, servers, storage, LCD TVs, handheld devices, and devices and equipment for medical applications.
The company reports its key products and services include design, manufacturing, after-sales support and recycling services covering notebooks, servers, enterprise mobility, automotive and networking segments, serving an international branded client base. Wistron employs over 80,000 people worldwide and has 12 manufacturing bases, 10 research and development centres. Its operations span Asia, North America and Europe. According to Wikipedia, Wistron reported revenue of NT$1,049 billion and net income of NT$30 billion for 2024. Subsidiaries include AOpen and Wiwynn, which focuses on cloud infrastructure products.
How Healthy is Wistron Patent Portfolio?
Patent portfolio health depends heavily on legal status distribution, and Wistron’s numbers show a mixed but workable picture. Granted patents make up 51.8% of the total, while pending applications add another 7.5%, giving an active rate of 59.3%. The remaining share splits across lapsed (21.5%), expired (16.3%), and revoked (2.9%) status, visible clearly in the composition chart. This spread suggests a portfolio that has been through several cycles of filing, grant, and natural attrition rather than one built purely for recent accumulation.
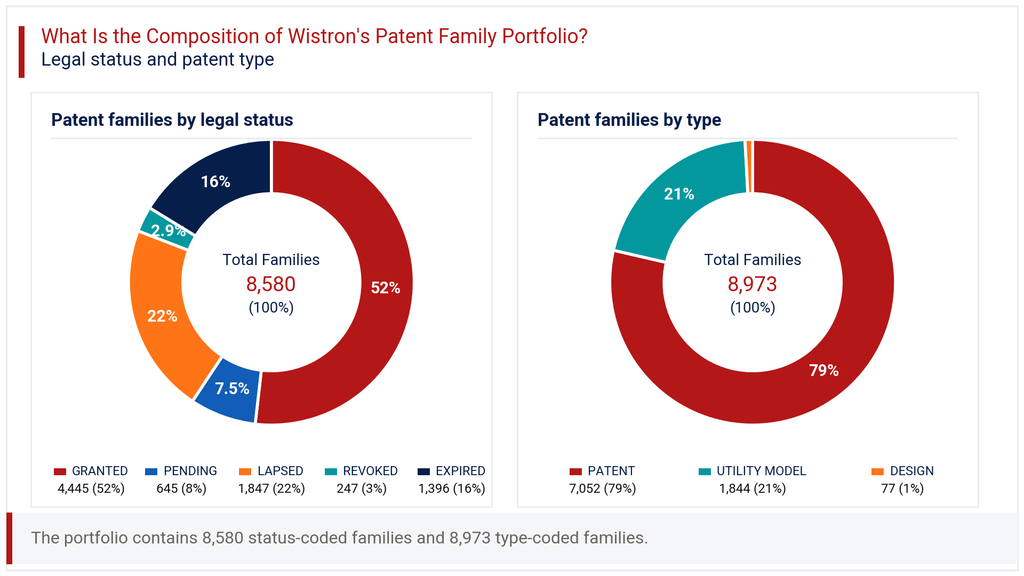
Patent type composition adds further texture. Standard patents account for 78.6% of filings, utility models for 20.6%, and design filings a small 0.9%. This heavy tilt toward full patents over utility models points to a preference for stronger, more durable protection rather than quick, lower-bar registrations. The low design filing share suggests Wistron’s patent strategy centres on functional and technical innovation rather than product aesthetics. Taken together, the legal status and type mix indicate a maturing portfolio with meaningful active protection, though a notable share of older filings has already lapsed or expired naturally.
How Has the Wistron Patent Portfolio Evolved Over Time?
Wistron’s patent filing trends show a long arc that builds, peaks, and then tapers. Filings before 2008 totalled 1,731 families, followed by a strong run between 2011 and 2013, where annual filings reached 702, 787, and 781 respectively. This three year stretch represents the clear high point of the company’s patenting activity, as shown in the filing-trend chart. After 2014, volumes dropped sharply, settling into a lower band of roughly 200 to 330 families per year through the early 2020s.
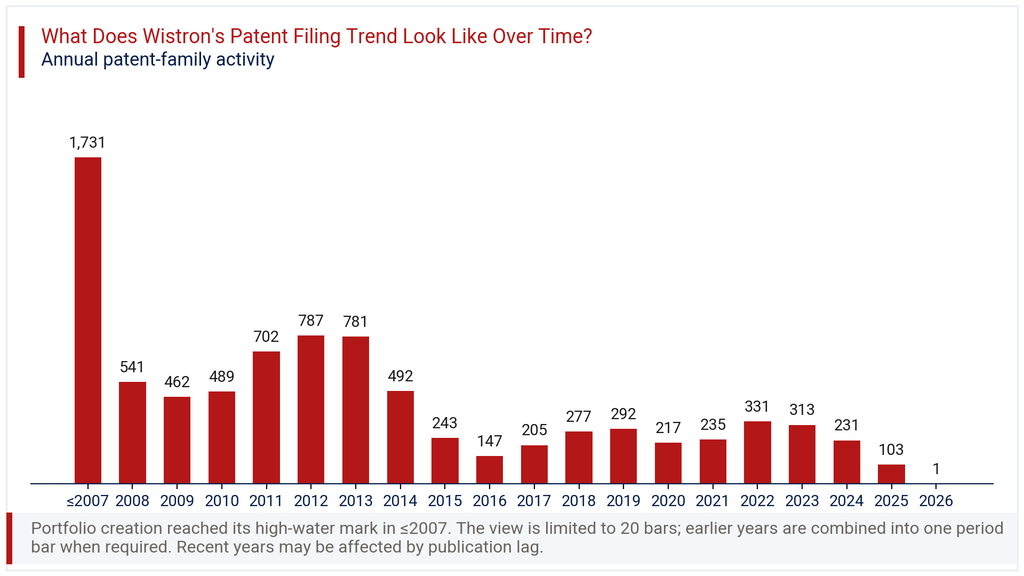
Recent years need careful reading. The 2025 count of 103 and the single 2026 filing reflect publication lag rather than a genuine collapse in activity, consistent with the -99.0% latest year change figure. Patent applications typically take many months to appear in public databases after filing, so the newest two years will always look artificially low. The more reliable signal lies in the 2019 to 2024 period, where filings held a relatively steady range between 217 and 331 per year. This suggests a company that scaled back from its 2011-2013 peak but maintains a consistent, moderate pace of ongoing invention.
Where Does the Wistron Patent Portfolio Prioritize Patent Protection?
Patent geography for Wistron centres firmly on three markets. Taiwan leads with 69.3% of filings (5,946 families), followed closely by China at 66.0% (5,667 families) and the United States at 55.4% (4,752 families). These three jurisdictions dominate the geographic chart and together account for the overwhelming bulk of the portfolio. This pattern reflects the home market, the primary manufacturing base, and the largest commercial market for electronics products.
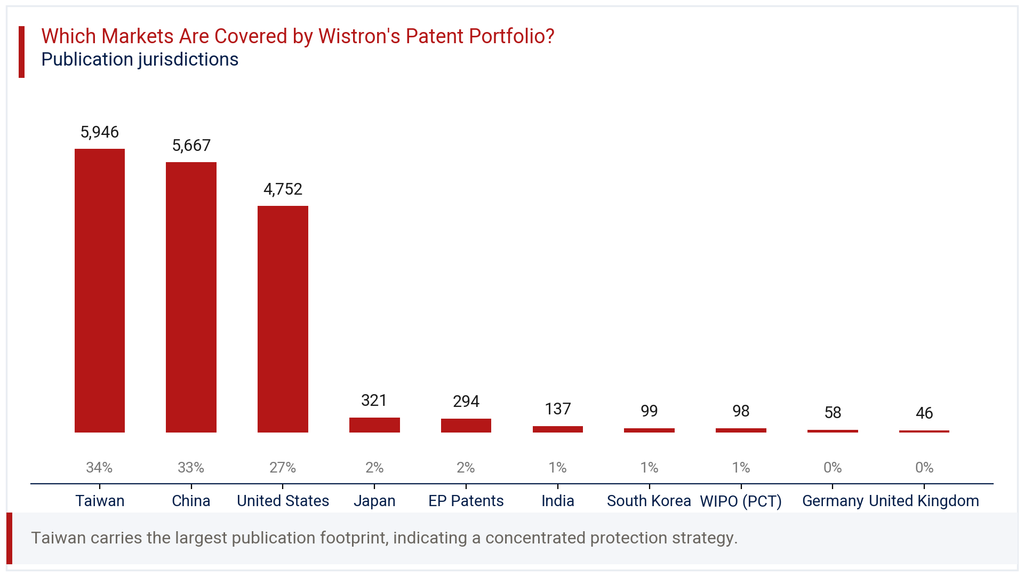
Beyond this top tier, filing drops off considerably. Japan holds 3.7%, EP Patents 3.4%, and India a smaller but notable 1.6% share. South Korea, WIPO PCT filings, Germany, and the United Kingdom each account for 1.2% or less. The portfolio spans 10 jurisdictions in total, indicating a filing strategy concentrated on manufacturing and core commercial geographies rather than broad global coverage. For a company operating across Asia, North America, and Europe, this concentrated approach suggests patent filing decisions follow production footprint and major client markets more than aspirational global reach.
Where is the Wistron Patent Portfolio Building Protection Across Key Technologies?
IPC analysis of the Wistron Patent Portfolio points to computing hardware as the dominant technical theme. G06F Digital Data Processing leads with 3,613 families, representing 37.3% of classified filings. This is followed by H05K Printed Circuits and Casings at 18.8% (1,821 families) and H01Q Antennas at 13.7% (1,327 families), both visible in the technology chart in this section.
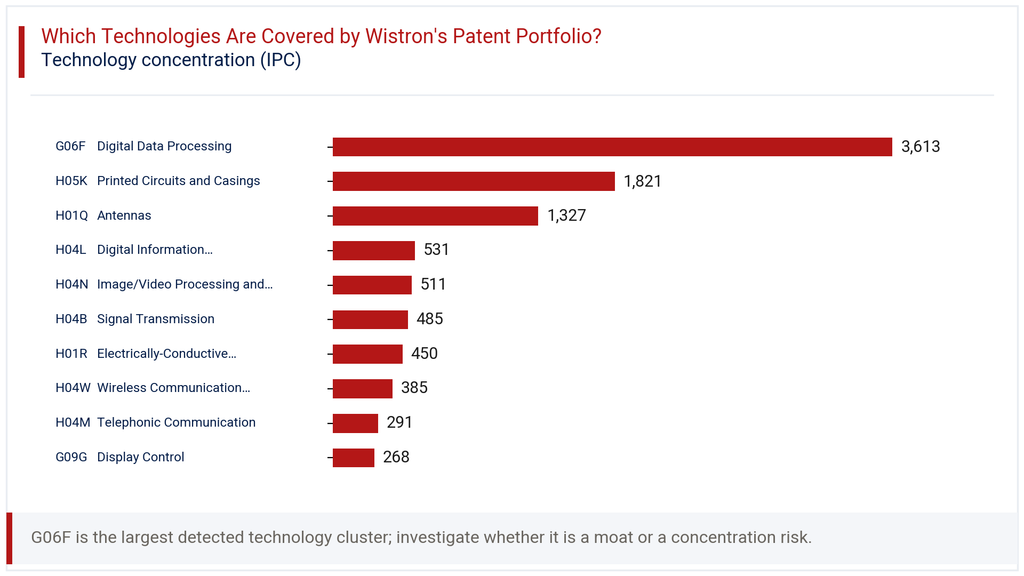
These three categories together account for close to 70% of all technology classified filings, a strong concentration. Supporting clusters include H04L Digital Information Transmission (5.5%), H04N Image/Video Processing and Display (5.3%), and H04B Signal Transmission (5.0%). Smaller but relevant categories, such as H04W Wireless Communication Networks (4.0%) and H04M Telephonic Communication (3.0%), round out a technology mix aligned closely with notebook, server, and connected device manufacturing. This distribution confirms Wistron’s patent filings track its core original design manufacturing business rather than unrelated or speculative technology areas.
How Has the Wistron Patent Portfolio Evolved Across Filing Geographies?
The heatmap of filings by year and jurisdiction shows Taiwan, China, and the United States moving almost in lockstep. In 2011, Taiwan filed 596, China 595, and the United States 402, each jump coinciding with the portfolio’s broader growth phase. By 2013, all three again peaked together, at 687, 688, and 469 respectively, confirming these markets drove the overall 2011-2013 filing surge in unison.
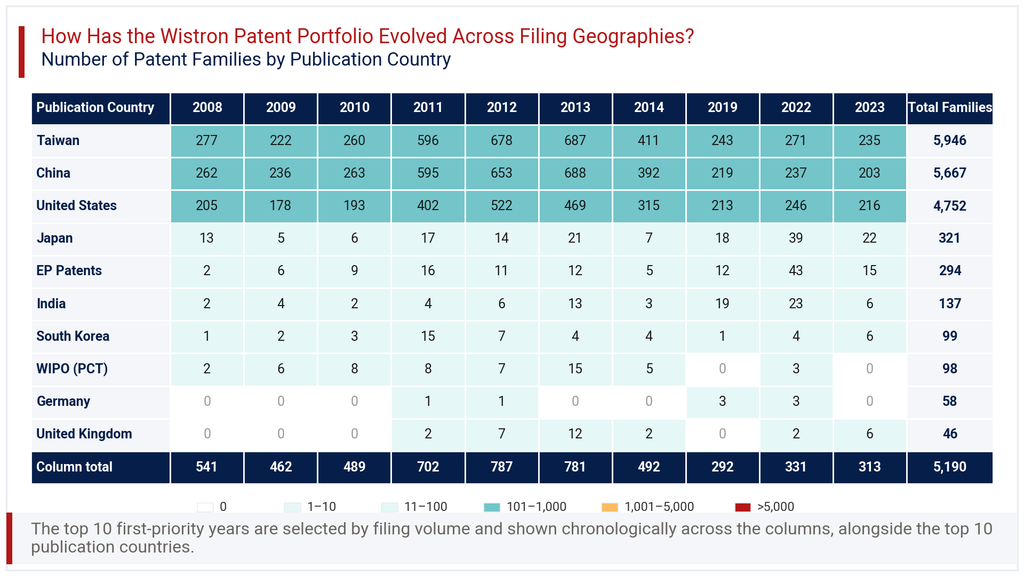
Smaller jurisdictions tell a quieter but still useful story. India’s filings rose from single digits in 2008-2010 to 19 in 2019 and 23 in 2022, a gradual but visible increase. Japan followed a similar modest climb, reaching 39 filings in 2022, its highest point in the matrix. The United Kingdom and Germany remain marginal throughout, rarely exceeding single digit annual filings. This pattern confirms that Wistron’s three core jurisdictions move together through cycles, while secondary markets receive selective, smaller scale attention tied to specific business needs rather than consistent year-on-year growth.
Consultant’s Perspective on Wistron Patent Portfolio
Viewed as a whole, the Wistron Patent Portfolio reflects a manufacturing driven filing strategy rather than an aggressive IP accumulation programme. The concentration in G06F, H05K, and H01Q categories tracks directly with notebook, server, and connected hardware manufacturing, Wistron’s core business. The three lead jurisdictions, Taiwan, China, and the United States, align with where the company builds and sells its products, a sensible and cost efficient filing posture.
The grant rate of 51.8% and active rate of 59.3% suggest a reasonably well managed portfolio, though the 21.5% lapsed share points to selective pruning of older, lower value filings over time. This is not unusual for a company with filings dating before 2008 still in the mix. The sharper filing decline after 2014, distinct from the 2025-2026 publication lag effect, deserves closer monitoring. It may reflect a genuine strategic shift toward fewer, higher value filings.
Companies assessing Wistron as a partner, competitor, or acquisition target should examine specific active families in their technology areas of interest. Filing volume alone cannot confirm technical strength or freedom to operate. A targeted review of recent grants in computing hardware and antenna technology would sharpen any such assessment considerably.
Explore Deeper Insights with Expertlancing Research
This overview only scratches the surface of what the Wistron Patent Portfolio can reveal about competitive positioning and technology direction. Expertlancing Research helps organisations go deeper, from family level validation to freedom to operate checks and competitor benchmarking. Whether you are assessing a partnership, tracking a competitor, or scoping an acquisition, our analysts can build a tailored patent intelligence study around your specific business question. Reach out to Expertlancing Research to turn this portfolio snapshot into a decision ready analysis.